


Futuremark Benchmarks
"Futuremark creates benchmarks that enable people to measure, understand and manage computer hardware performance. Our talented team creates the industry's most authoritative and widely used performance tests for desktop computers, notebooks, tablets, smart phones and browsers."
Since 1997 Futuremark has been pumping out a variety of benchmarks that can used to test nearly every aspect of your PC. They have kindly provided us with the software necessary to kickoff our GPU reviews!
3DMark11
While 3DMark11 isn’t the newest benchmark around it’s a classic that has been used for ages and we figured we may as well bring you the numbers! We tested on the “Extreme” preset, no other modifications were done. This benchmark was interesting because it was the only one that the GTX 970 ACX and GTX 780 HOF traded blows on.
While 3DMark11 isn’t the newest benchmark around it’s a classic that has been used for ages and we figured we may as well bring you the numbers! We tested on the “Extreme” preset, no other modifications were done. This benchmark was interesting because it was the only benchmark that the GTX 970 ACX and GTX 780 HOF traded blows on.
For the most part we expected the GTX 970 and GTX 780 to be pretty neck and neck. Luckily EVGA has the 970 SSC clocked high and it’s able to beat out the previous gen. Below you can see a graph that details the GPU usage, max CPU thread usage, and the FPS during the benchmark. The drops are the loading screens between the individual benchmarks that make up 3DMark11.

3DMark Vantage
The next benchmark is the infamous 3DMark Vantage. It’s our oldest benchmark today but alongside 3DMark11, it’s an instant classic that we wanted to run for everyone.
Unlike 3DMark11 however, the GTX 780 HOF managed to overtake the GTX 970 ACX. Given the age of these two benchmarks though we aren’t basing our review off of the scores seen here. Again, below, is the Usage/FPS report.

Fire Strike Ultra
Getting into the more modern benchmarks from the guys at Futuremark, we have their latest one next, Fire Strike Ultra. Similar to the ever popular Fire strike and Fire Strike Extreme, Ultra turns it up to 11 and runs at 3840×2160.
Compared to the first two older benchmarks, Fire Strike is one of the best benchmarks for measuring performance numbers in a controlled manner. As you can see the GTX 970 pulls ahead of the competition, except for the dual GPU Titan-Z of course. It even manages to best the highly overclocked GTX 780 HOF.
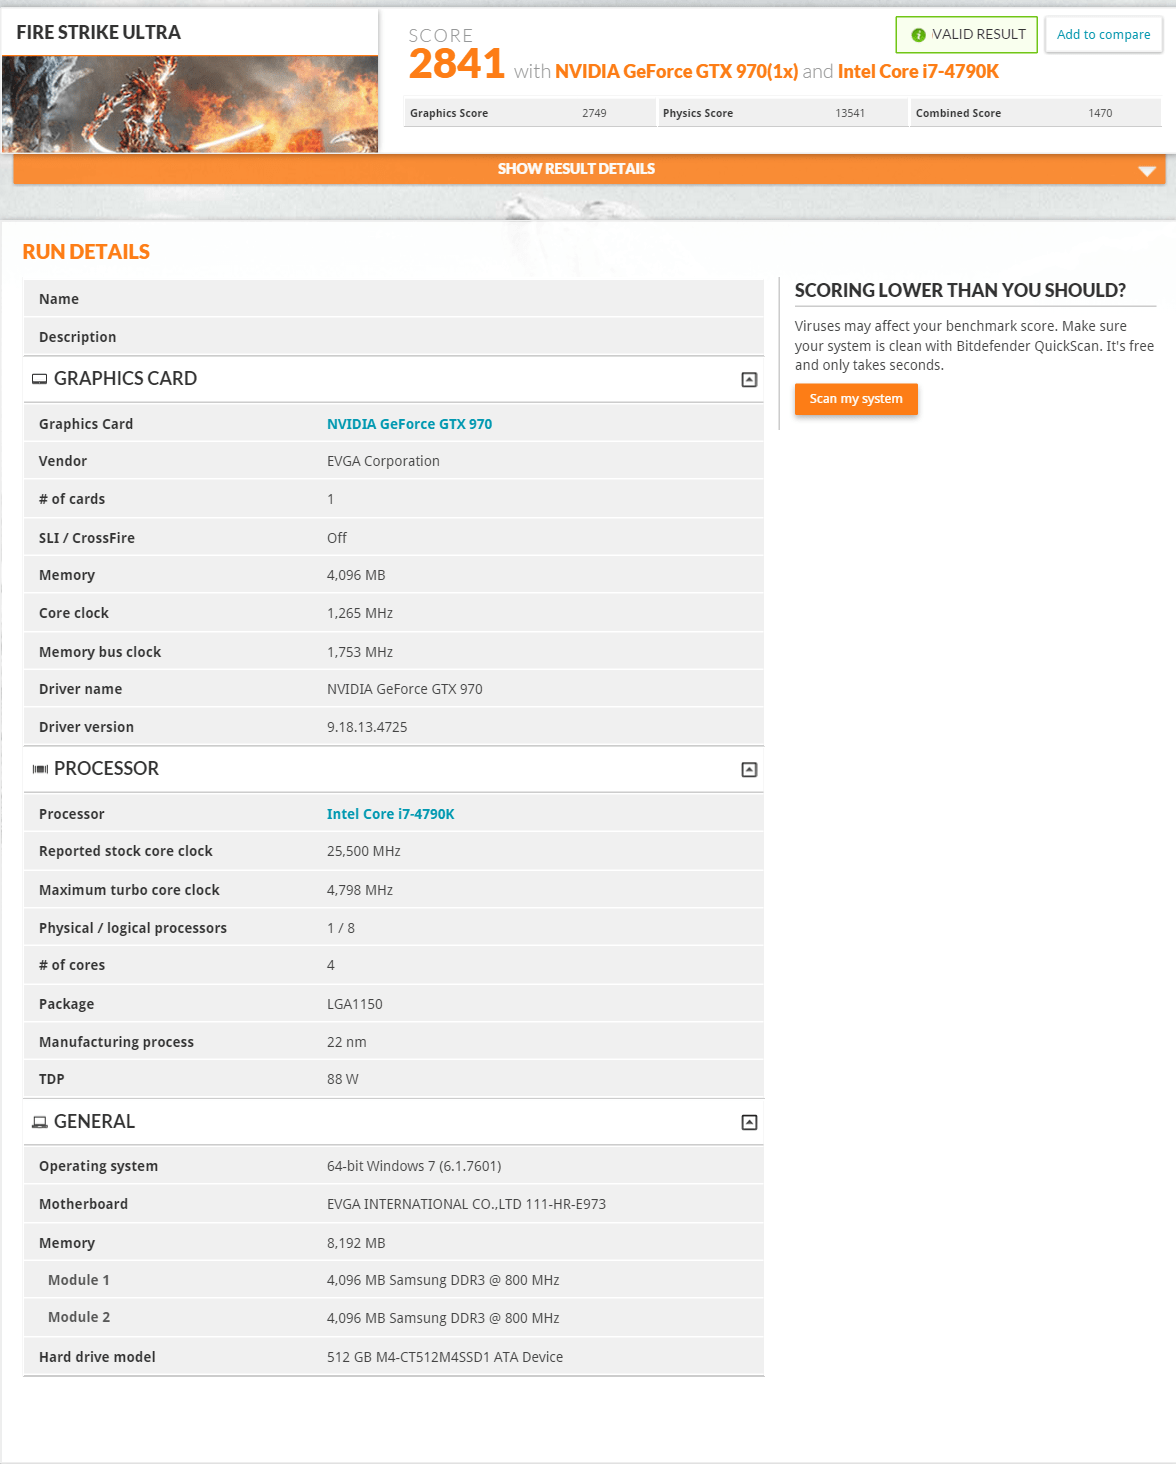
Below you can see the Usage/FPS report. The drops are again transitions in the benchmark to different tests.

Fire Strike Extreme
Fire Strike Extreme is next, instead of running at 3840×2160 like Ultra, it runs at a resolution of 2560×1440.
Just like with Fire Strike Ultra, the GTX 970 pulls ahead of the competition.

Usage/FPS Report

Sky Diver
Sky Diver was also introduced recently but Futuremark recommends it mostly for testing laptops and mid-range PCs hence frame rates with good GPUs will be high! Here are the numbers for your reference though.
And the Usage/FPS report.

Cloud Gate
Similar to Sky Diver, Cloud gate is meant for notebooks and home PCs. Numbers for your reference:
Usage/FPS Report

While we ran most of the benchmarks included in the 3DMark package, the Fire Strike series are the most accurate for testing high end GPUs. The scores represented there will provide users with the most accurate measurements. The rest of the benchmarks are for your reference only if you want to compare against your own hardware, systems, or mobile devices.
As the first benchmarks we ran, we were instantly impressed by the GTX 970. We had expected it to be on par or just above the GTX 780 HOF but even at the base clock speeds that EVGA gave us, it was beating out the overclocked 780!
Read on for Heaven & Valley benchmarks!


[…] […]
Comments are closed.