


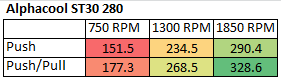
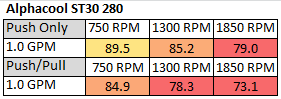
This first table shows the ST30 280’s Watts/10 Delta Temp numbers in a quick glance chart format.
Using this data we can effectively show percentage gains/losses relative to a reference point. It’s an interesting way to show gains/losses while changing a variable.
So, let’s focus on 1300 RPM as our reference and see how much gain or loss in performance we get by changing fan speed.
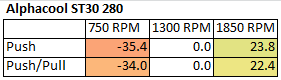
From these results we see a ~35% drop in performance of from 1300rpm to 750 in both Push Only and Push/Pull. The modest increase of ~23% with the next fan speed increase is similar to those gained by the other slim radiators of the test group. This indicates the ST30 280 is likely best tuned for medium speed fans. This makes sense when we consider it’s thickness, the extra air volume of higher rpm fans are not as much benefit as it is on radiators with thicker cores.
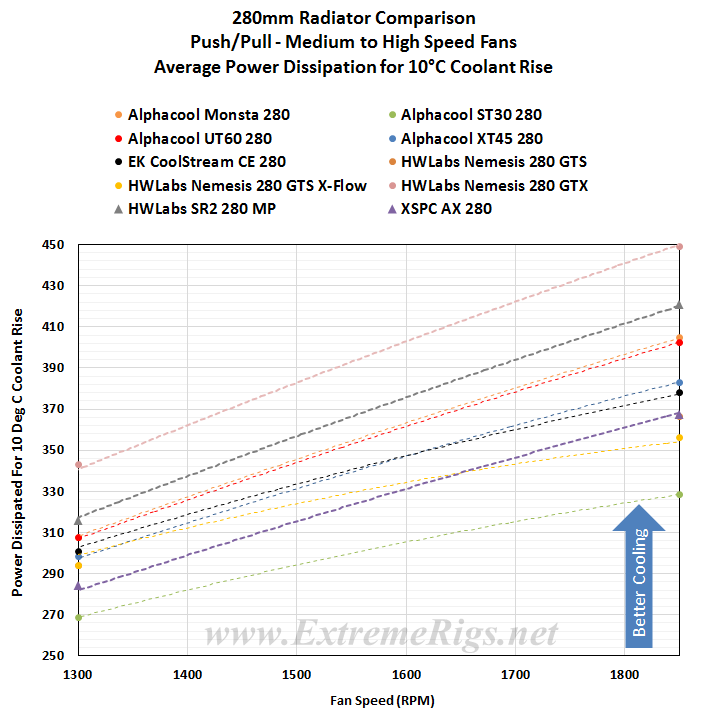
So from the data above we’re getting a good idea of how the ST30 280 radiator performs relative to itself. But there is a large selection of 280mm radiator models to choose from, so let’s put the ST30’s results into some comparison charts.
Push Only Data vs Competition
In general, thicker radiator perform better than thinner radiators of the same size (fan capacity) but a lot also has to do with how each core has been designed / tuned; number of tubes, thickness of tubes, fin array etc.
So with that in mind, we should try to stay focused on the slim radiators which are the direct competition of the ST30, those being the 2 GTS variants by HWLabs and possibly even the AX 280 from XSPC which is 10mm thicker.
Focusing on the Push Only results for now, let’s see how the ST30 280’s performance compares to the competition.
Let’s start with 750 RPM.
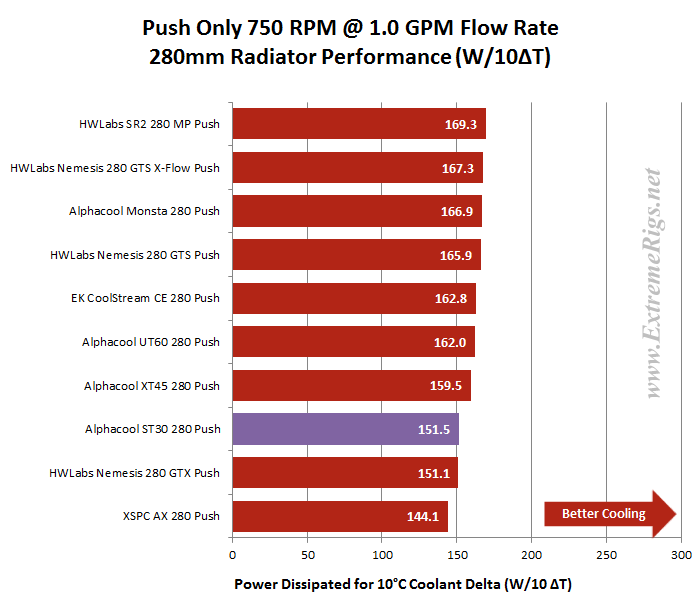 Clearly the ST30 280 has placed in the lower half of the results at Push Only at 750 RPM. With ~10% difference between it’s result and the best performing slim radiator in the lowest air test, let’s hope things improve when we add more air flow.
Now let’s look at 1300 rpm:
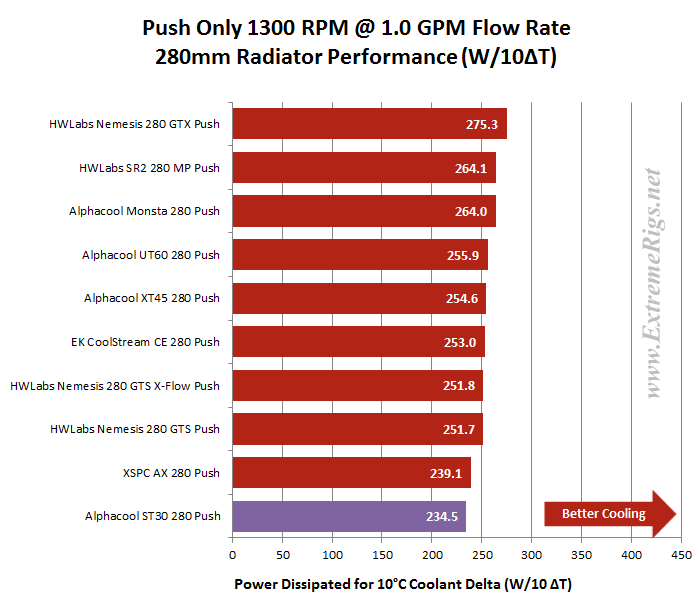 At Push Only 1300 RPM the ST30 280 finished in last place but gained ground on the other slim radiators, now being ~7% behind the best of them,.
Now 1850 rpm Push Only:
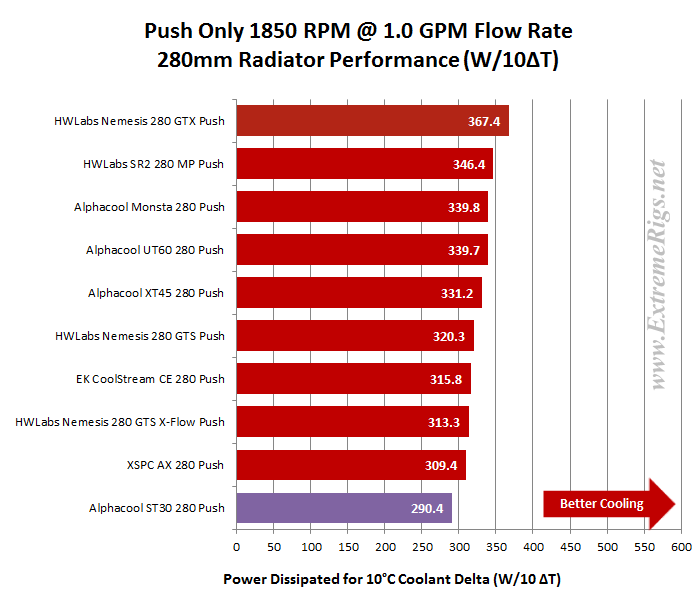 At 1850 rpm the ST30 280 again finishes in last position overall and has dropped a few percent to now be ~9.5% behind the best of the slims.
Let’s find out how the ST30 280 performs with Push/Pull fans.
Push/Pull Data vs. Competition
Firstly the 750 rpm:
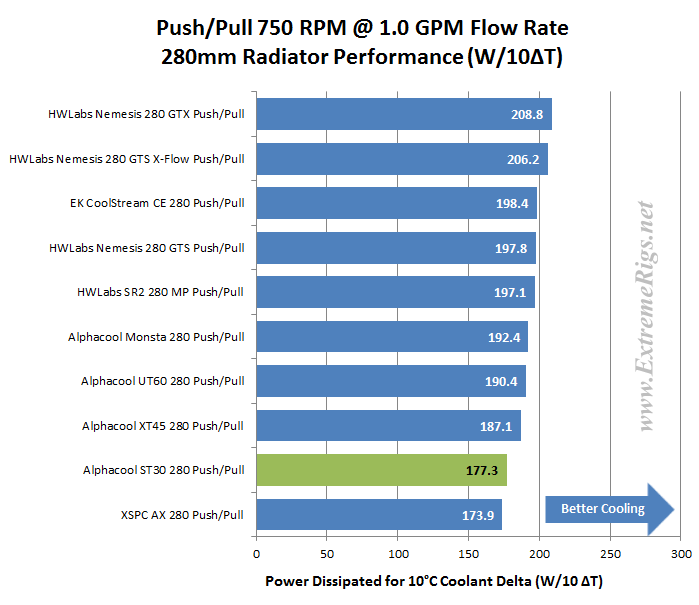 The ST30 280 is again near the bottom of the group at this data point, ~14% behind the best of the slim radiators
Let’s move to 1300 rpm:
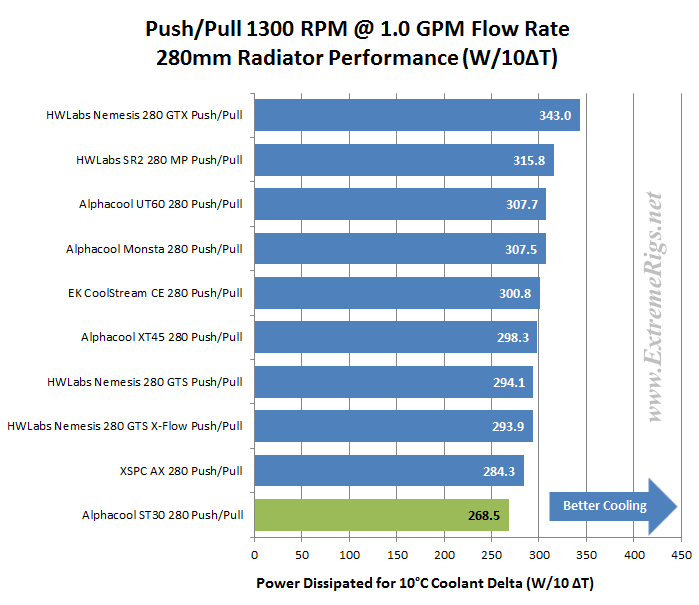 The ST30 find itself in a familiar position, again at the bottom of the results table.
Now 1850 rpm:
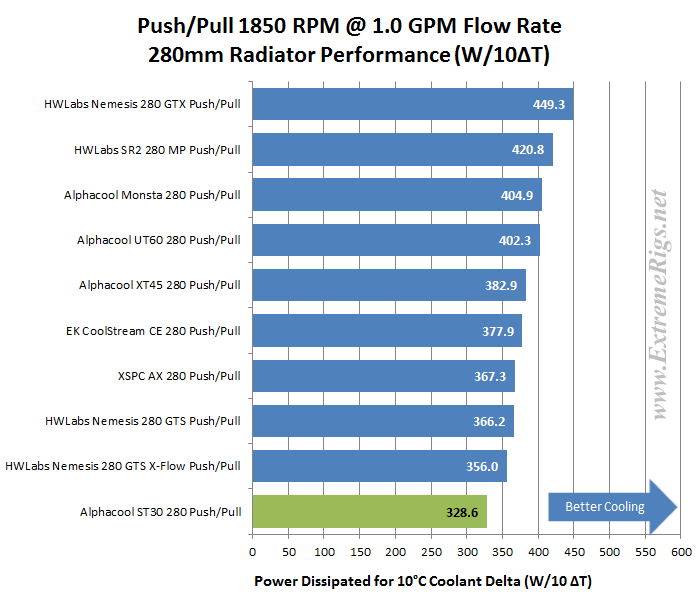 At 1850 rpm Push/Pull the ST30 280 takes another last place. At this data point it was a whopping 27% behind the first place Nemesis GTX and ~10% behind the best performing slim radiator.
Another view of the same data, this time plotted as curves and some extrapolation added.
Be warned these plots can be hard to read given that many results are similar at the same data points.
Again the Push Only data first:
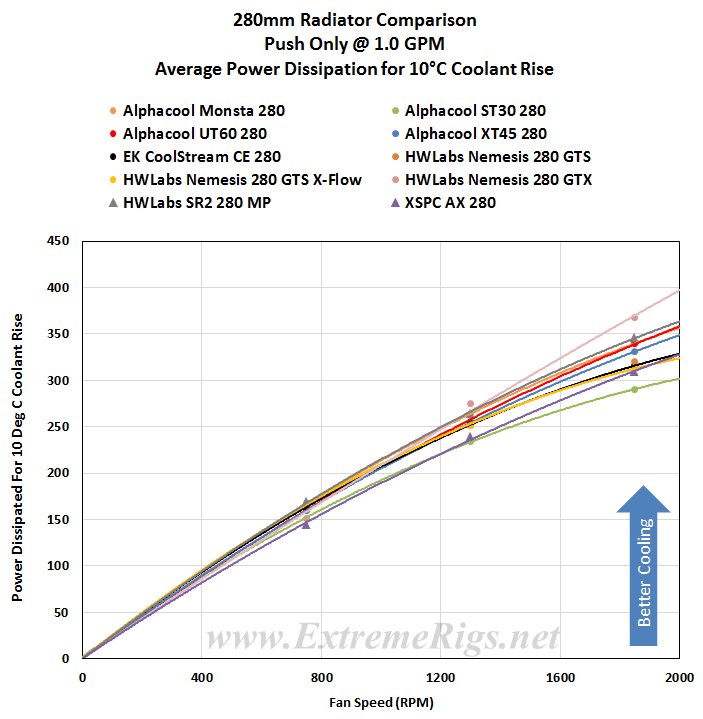 This perhaps best shows how close the results are, particularly with low speed fans.
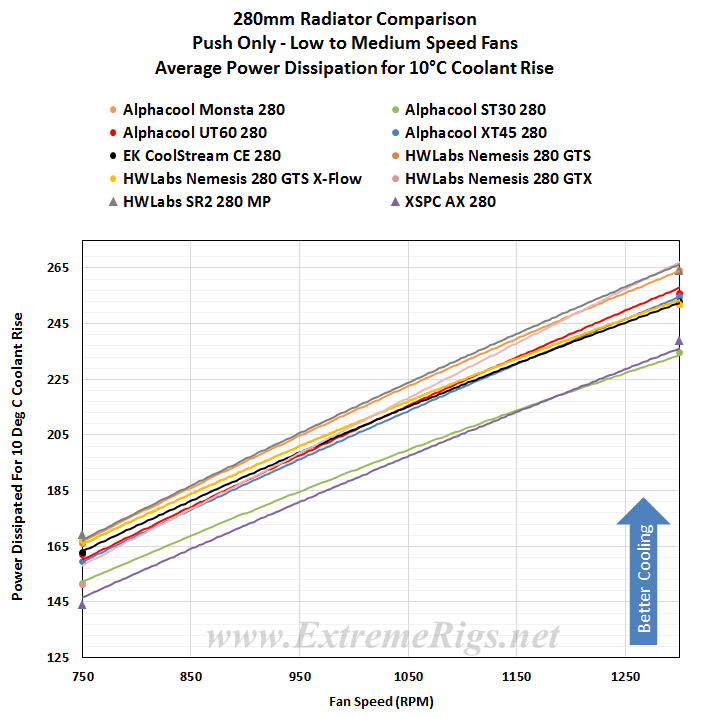
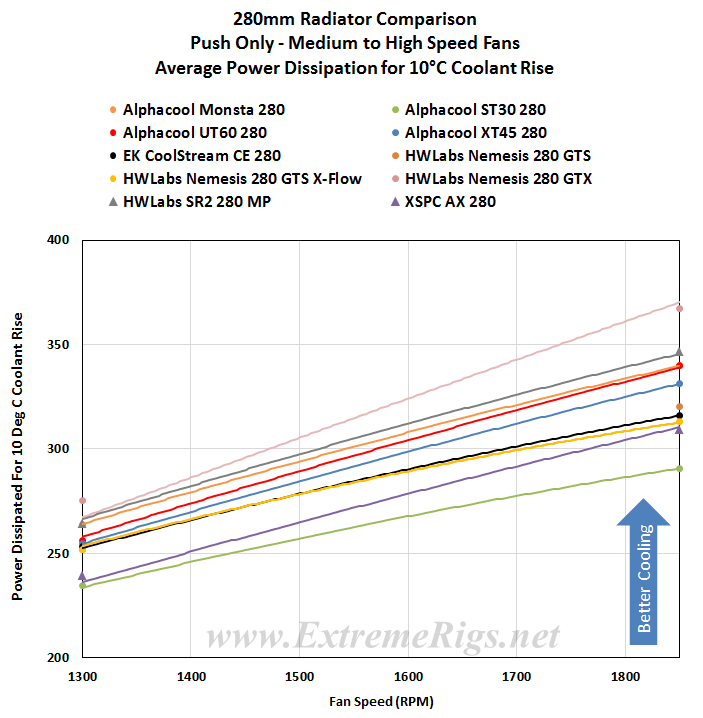
Because the data curves in plot above are almost blurred into one another, we have split it into two separate plots; 750 rpm to 1300 rpm and 1300 rpm to 1850rpm and zoomed in on those fan speed zones.
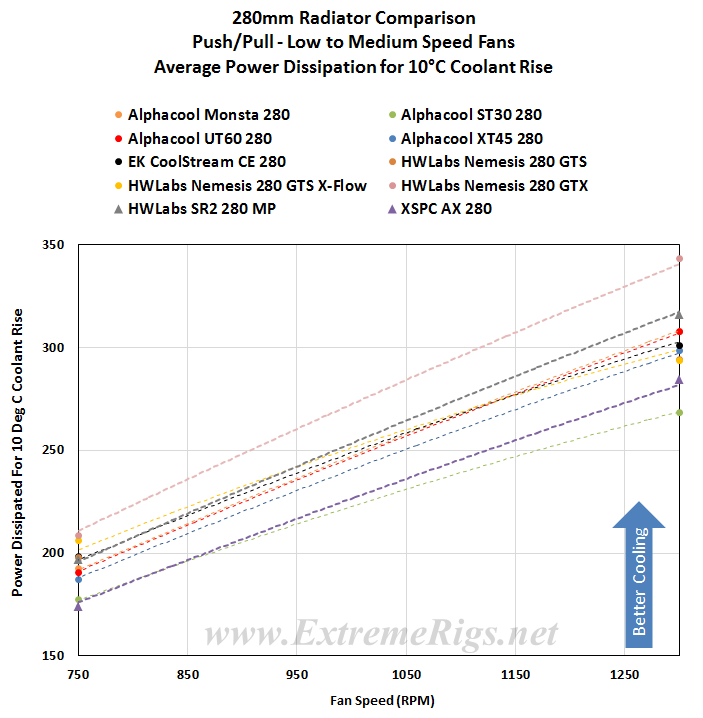
Now the Push/Pull results are plotted, again followed by split and zoomed versions.
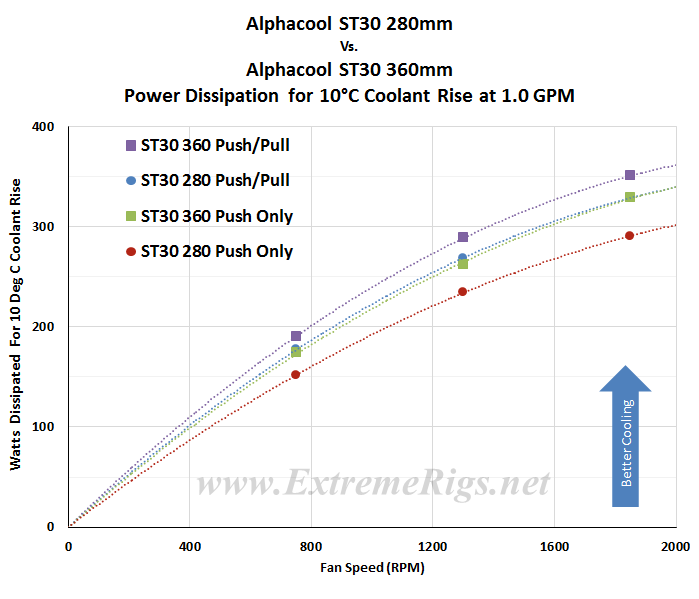
ST30 280 vs. ST30 360
Before moving on let’s take a quick look at the thermal results for the ST30 280 and ST30 360 on the same plot. This is one of those “just for fun” plots because in reality we can’t make a 1 to 1 comparison between the two sizes because of the differing performance of the fans used.
The ST30 280 has ~10% less surface area than the ST30 360. Knowing that and the difference in fans used to test the 120.x and 140.x radiators, interpret the following as you will.
Push Only 750 rpm: ST30 360 was ~13% better.
Push/Pull 750 rpm: ST30 360 was ~7% better.
Push Only 1300 rpm: ST30 360 was ~10.5% better.
Push/Pull 1300 rpm: ST30 360 was ~7% better.
Push Only 1850 rpm: ST30 360 was ~11.5% better.
Push/Pull 1850 rpm: ST30 360 was ~6% better.
Which is an overall average of 9.75% better performance in favor of the ST30 360, which has a 9.25% greater surface area. That’s pretty cool right!
BUT, what I find most interesting is that The ST30 360’s Push Only results were almost equal to the ST30 280’s Push/Pull results.
Average Performance Factors
From every radiator tested we create APF “Average Performance Factor” charts from both the Push Only and Push/Pull results. We also make a combined plot of the average called the “Master Performance Factor”. The radiator with the best cooling ability (W/10ΔT) at each rpm is awarded a score of 100 and every other radiators W/10ΔT result is scored as percentage of the top performer.
This way of looking at the comparison takes away any advantages that a radiator may have at higher or lower fan speeds and looks at an overall average. While this appears fair it does tend to favor those radiators that are all-rounders and those radiators which do very well at high RPM. Most users should be more focused on their specific use case.
Here are the ST30 280’s APF percentage scores at each data point:
 The ST30 does have the thinnest core of the test group and we saw it’s W/10ΔT results, so we should already know what sort of results we are going to get here.
As these percentage scores are relative to the best performer at each data point, we again advise readers to cross reference specifications and results for each radiator and keep in mind your case space available, intended fan assembly and operating speed.
The percentage numbers in the table above offer another way of looking at the ST30 280’s results. But for our scoring system we need a way to reduce the categories while retaining the data. To do this we average the results for each fan assembly type giving us Averaged Performance Factors.
Firstly – the Push Only APF:
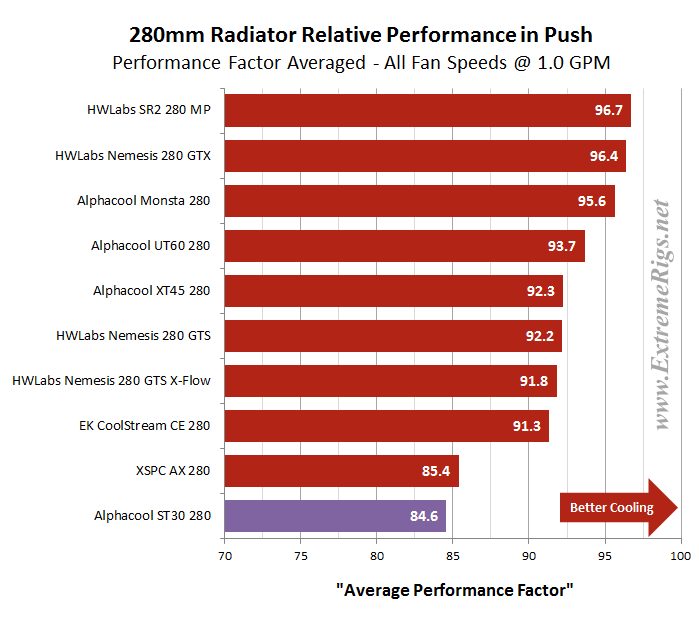 With an 84.6 % Averaged Push Only result the ST30 280 places last, very close to the AX280 which is 10mm thicker.
Now the Push/Pull APF:
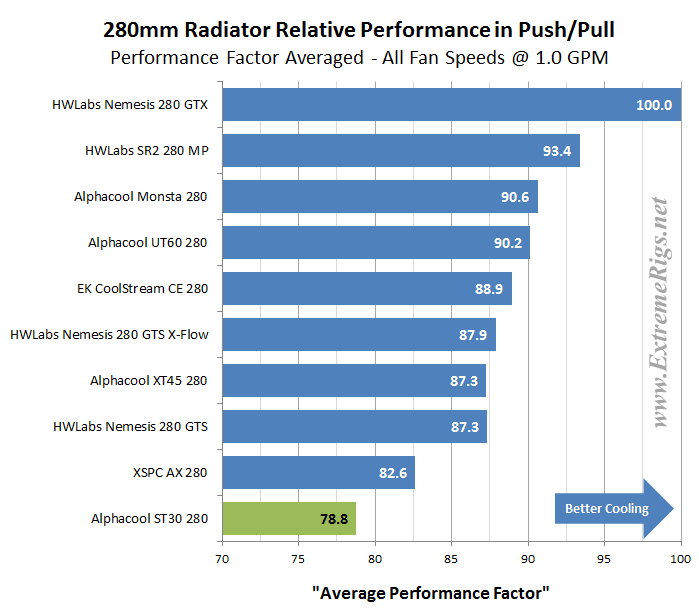 In the Push/Pull APF the ST30 280 again takes last place. Any weak points were somewhat magnified by the 100% score on the Nemesis 280 GTX. The very thin 16.5mm core of the ST30 380 is just not capable of dissipating as much heat as the thicker cored radiators.
Finally we created the Master Performance Factor which is calculated from the averaged results of all the Push Only and Push/Pull thermal tests, at all fan speeds.
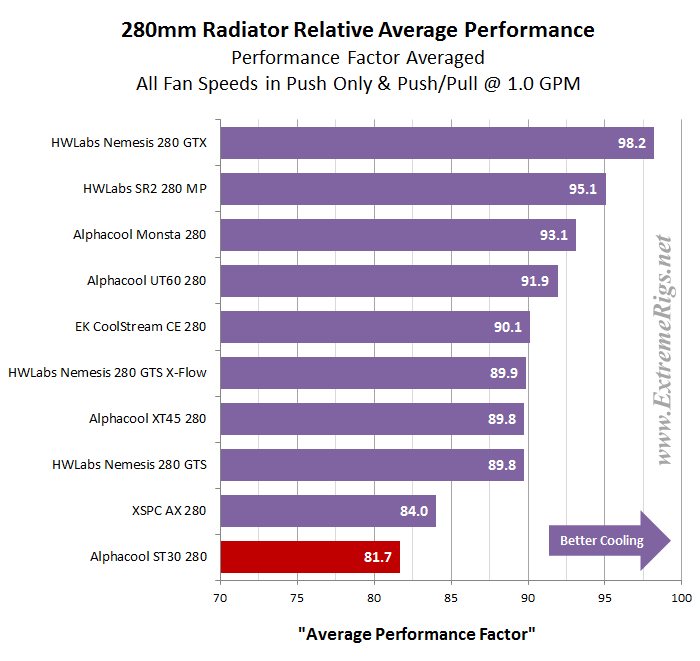 Finishing ~8% behind the best of the slim radiators, the ST30 280 is probably not an option those looking for maximum performance are going to be considering.
Space Efficiency
The ST30 280’s space efficiency vs. performance ranking is likely to be a breath of fresh air after being battered in the thermal performance rankings. Thinner rads almost always produce better results here than their thicker counterparts. We have used the Average Performance Factor results from the charts above to compile two plots which shows us how it compares to the other rads in terms of performance Vs. space taken.
First up is Radiator Thickness Vs. APF
Here the combined APF scores were divided by the radiator thickness only, with the highest (most space efficient) issued a score of 100. Each of the other radiators results was converted to a percentage of the most space efficient radiator’s score.
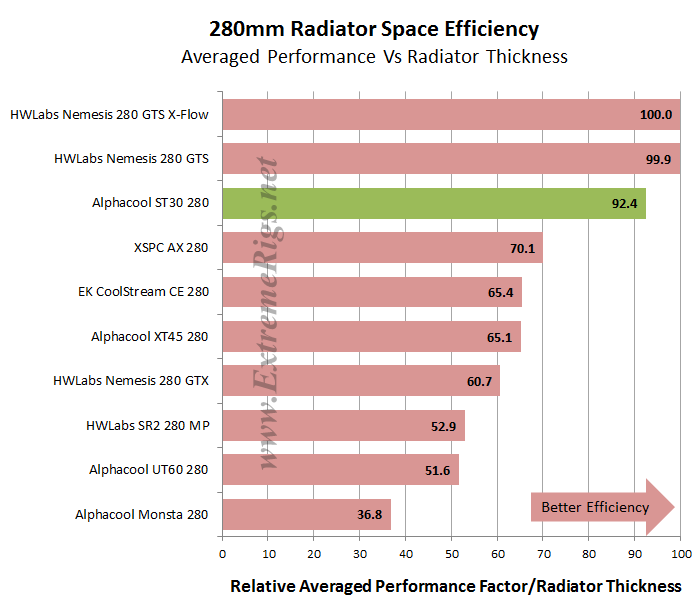 The order has ended almost in order of thinnest to thickest and as anticipated the ST30 280 fared quite well in this assessment. It’s 3rd place results was ~7.5% behind the winner.
Next we took the APF results for Push/Pull and divided it by the total thickness including the fans and applied the same scoring system. For the Push Only we used the Push Only Vs Push/Pull comparative results and applied the same scoring system when compared against the Push/Pull.
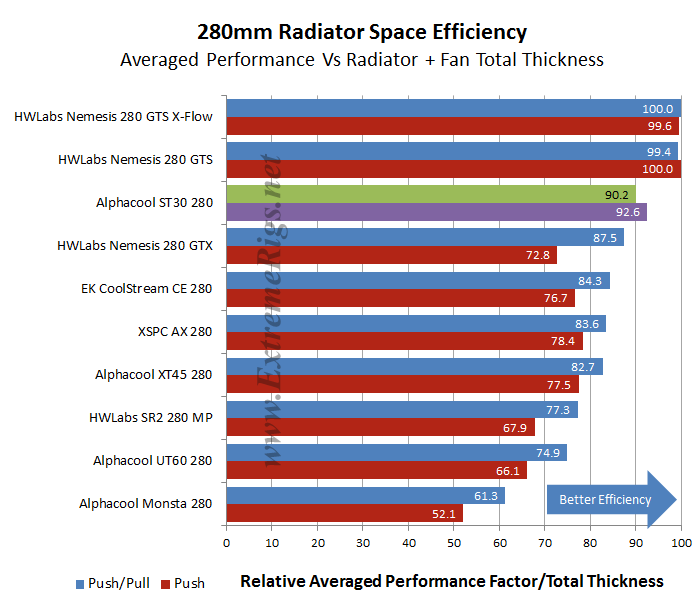 Again the results at the top of the table are the same with the ST30 taking 3rd place.
Value Factor
While our APF’s are still fresh in mind, let’s now look at the Performance Results vs Price to show which of the 280mm radiators might offer the best bang for your buck. Each radiator’s combined APF scores were divided by the radiator cost and again we applied our scoring system of percentage Vs. the best result of the category.
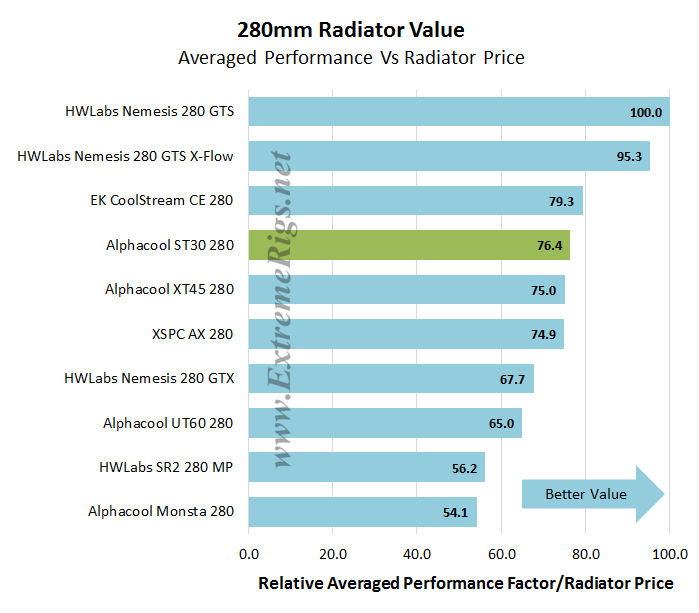 The ST30 280’s Value Factor turns out to be reasonably good, helped mostly by the fact it is the 3rd least expensive radiator of the test group. This tells us that it is reasonably good value for the performance potential it offers. While being ~23.5% behind the best value radiator, in reality the difference is not so great as the chart makes it appear, but when visualizing with percentages as we have done, the gap appears large.
Generally value and space efficiency metrics usually correlate – thicker radiators which are generally better performing do contain more material after-all and so are usually also more expensive.
Next Up – Summary!
![]()


[…] Alphacool ST30 280 Radiator Alphacool UT60 280 Radiator Review Alphacool Monsta 280 Radiator EK CE 280 Radiator Hardware Labs Nemesis GTS 280 Radiator Hardware Labs Nemesis GTS 280 X-Flow Radiator Hardware Labs Nemesis GTX 280 Radiator Hardware Labs SR2 Radiator XSPC AX 280 Radiator […]
this rad is very special in a way that it’s probably the smallest 280 rad. it’s not only thinner, it’s also shorter and narrower than other 280 rads. for example it is almost 1cm narrower than HWLabs GTS 280. this small size allows to use it in systems were no other 280 rad will fit. for example in Fractal Design Define S/C series of cases, only alphacool 140/280/420 rads will fit the front. so it performs quite well considering the size.
what i’d like to see is the performance comparison with 240 rads
Comments are closed.