


The Thermal Data
Moving on from the restriction test bench the CoolStream SE 360 was loaded into the thermal test chamber for a series of tests – consisting of 3 flow rates, each having 3 different fan rpm rates tested. I felt the thermal test data was most important and which you as the reader would be most interested in.
Below is the final data results gathered from at least 2 data logging runs at each flow rate and fan rpm combination. The most stable 15 minute period from each logging run was used and then averaged with the other runs to obtain the data for the table below. A total of 16 temperature sensors were used in the thermal test chamber (8 air in, 2 air out, 3 water in, 3 water out) each take a reading every second and logged via a CrystalFontz unit. The data in the table below is the averaged results of the logging runs which has then been used to create all the plots and tables there-after.
 The performance metric of critical importance is the delta between the warm coolant temperature in and the cold ambient air temperature in to the radiator. Given that the system is well insulated and in equilibrium and we know the heat input to the system then we can also calculate a very important number – that is the amount of power required to raise the coolant temperature 1C (or 10C which is more useful reference point).
Let’s take a look at the Delta T results from the tests.
 We’re not too concerned about the actual delta numbers here, more so if a trend pattern between fan speeds is occurring. It’s interesting to see the Push Only which is 1.0 gpm catch the 0.5 gpm Push/Pull as the fan speeds increase.
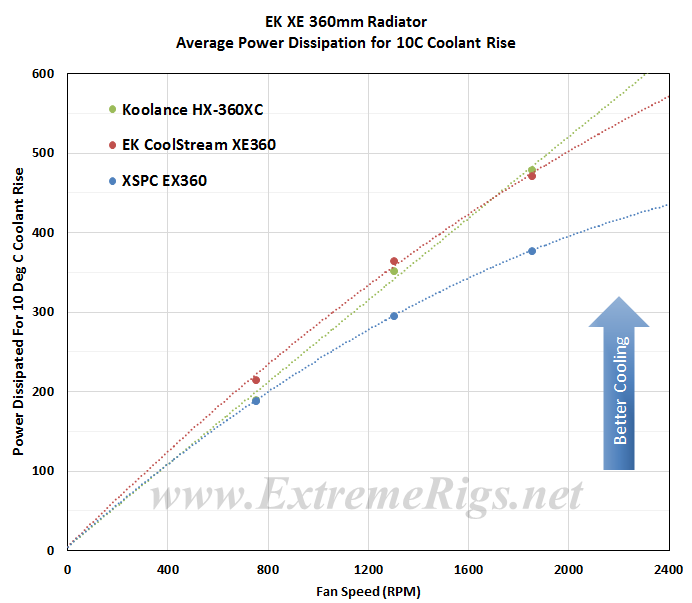
Delta T results (as above) is not always helpful when thinking about how many radiators you would need to cool your system. Instead it’s more useful to know the delta/W, or more usefully, the inverse metric of W/delta C. The metric plotted below tells us how many watts are dissipated by the radiator when the coolant rises 10C above ambient temperatures. (W/10 Delta T):
 As expected increasing airflow through the radiator is the primary determinant in changing the radiators performance.
This data can now be plotted as a pretty curve so that an end user can interpolate their own fan speed. Note again that the extrapolation of the curve is much more sensitive to error than in between the tested range. Let’s exclude the push data for now and come back to it:
 The tightly bunched lines is evidence that increasing flow rate is yielding little benefit in performance, particularly at low fan speeds.
If we now come back to the push data it’s good to compare only the push to push/pull data in an “apples to apples” fashion by only looking at the 1GPM data:

Push only gives around 92% (averaged) of the performance of the Push/Pull 1.0 gpm test results on this radiator. The very curved nature of the Push/Pull plot line indicate that the SE is close to its maximum power dissipation in our high speed fan tests, while higher Delta temps for Push Only means there is still some performance in left in the tank for Push Only fan assemblies.
In this next chart all three Push Only results at 1.0 GPM flow rate were plotted to produce one curve and we compared the results against the other slim rads Push Only results.

Now let’s compare Push vs Push/Pull:
For the Push/Pull comparison chart we have averaged the 3 fan speed test results at each flow rate to produce the curves. Averaging reduces test error of course so this helps further to be sure of our data and is more useful therefore for comparing to other radiators.

The SE is clearly the weakest performing rad of the group in both the Push Only and Push/Pull comparisons.
Now let’s analyze that data some more…


[…] EK CoolStream SE 360mm Radiator Review […]
Thank you for doing this terrific review. It is very useful in the context of the earlier radiator round up you did. Really appreciate the methodology. I am currently choosing slim radiators for a new build; although the Hardware Labs Nemesis GTS series are almost impossible to find in Europe, I think that I will pay up for shipping and customs charges to get a pair sent to me in the UK.
(I’ve tried Hardware Labs importers / retailers in the UK, France, Germany, Italy and the Netherlands: all have terrible stock levels, usually only stocking a few old / superseded models and nowhere like the full range. When I have contacted the UK and Dutch importers to special order two Nemesis GTS they either tried to sell me different radiators that I did not want but which they had in stock, or replied saying we can’t order anything from Hardware Labs for you, or didn’t even bother to reply).
Another great review FF, thanks.
Some surprising results for the SE! Man, I yell ya, I am giving up trying to make predictions. I was concerned that the move to 1.5mms tubes would mean high restriction but it’s really quite reasonable. Quite disappointing thermal results that is hard to understand considering how well it’s thicker brother did.
I guess it just shows how valuable your work is because we just can’t make any assumptions.
Hey Jak,
Yeah this one was pretty low across the board.
I Just finished another 360mm slim rad, it was weaker than the SE with low speed fans, especially in Push Only, but turned out to dominate in the high speed fans because it has a very high FPI count.
I used to try and make predictions, but but doing so can be dangerous, as the predictions can slip easily into assumptions, which in turn tend to make you look for patterns in the data which may or may not end up being there. At this stage you’re questioning the validity of the results, and do a retest, only to get the same results.
Better for sanity’s sake to accurately set the test parameters, and then trust the data that is logged.
Comments are closed.