


The Data
As all the testing in this round-up was performed with the exact same equipment, using the exact same methods I have decided to keep each radiators page uncluttered by posting our testing methodology, test set-ups and equipment used in a single location. To see exactly how the tests were carried out, details of the test set ups and equipment used, please head back to the RRU Test Setup page.
Restriction Test
It’s generally agreed that radiators are one of, if not the least restrictive components in the water cooling loop. There are some exceptions however, so this must still be verified through testing:

The above photo is for referencing the restriction test bench The SE is not loaded so please disregard the data in the picture as it does not relate to the its test results.
Here is the raw data at the tested flow rates, displaying the measured Differential Pressure across the radiator as flow rate was increased.
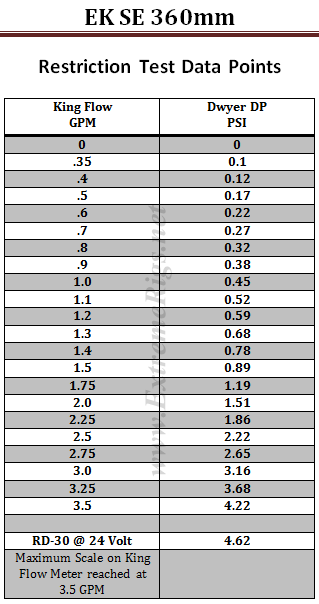 The table numbers indicate that the SE 360 is a medium to high restriction radiator. However numbers in isolation can only tell half the story. By plotting against other components it more easily shows the whole story
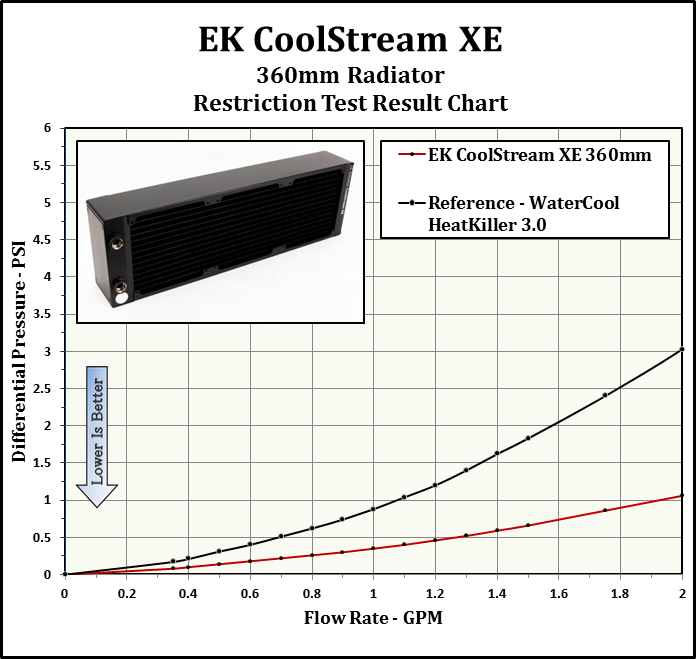
I have decided to use a HeatKiller 3.0 CPU block as the reference in these plots for two reasons. Firstly there is no chance of the plot being cluttered by curves overlapping and secondly it gives a reference point against a fairly common loop component of average restriction.
As with all the radiator restriction plots I have limited the maximum flow rate displayed to 2.0 GPM as I suspect there are very few systems that operate above 2.0 GPM. For more information on how to read a restriction plot check out our guide.

This plot shows us that the SE as a low/medium restriction component. Let’s see how it fares against the other radiators in the test group.
The next three plots show the SE’s restriction level relative to other slim radiators in the test group at 3 different flow rates – what we consider to be low, medium and high system flow rates.


From these tables it would be fair assessment to call the SE 360 a medium restriction radiator when compared to the other slims, but before we make that conclusion let’s take a quick look at the restriction levels all our 360 rads at 1.0 gpm.
 So the medium restriction assessment still appears valid.
Onwards to Thermal Performance!


[…] EK CoolStream SE 360mm Radiator Review […]
Thank you for doing this terrific review. It is very useful in the context of the earlier radiator round up you did. Really appreciate the methodology. I am currently choosing slim radiators for a new build; although the Hardware Labs Nemesis GTS series are almost impossible to find in Europe, I think that I will pay up for shipping and customs charges to get a pair sent to me in the UK.
(I’ve tried Hardware Labs importers / retailers in the UK, France, Germany, Italy and the Netherlands: all have terrible stock levels, usually only stocking a few old / superseded models and nowhere like the full range. When I have contacted the UK and Dutch importers to special order two Nemesis GTS they either tried to sell me different radiators that I did not want but which they had in stock, or replied saying we can’t order anything from Hardware Labs for you, or didn’t even bother to reply).
Another great review FF, thanks.
Some surprising results for the SE! Man, I yell ya, I am giving up trying to make predictions. I was concerned that the move to 1.5mms tubes would mean high restriction but it’s really quite reasonable. Quite disappointing thermal results that is hard to understand considering how well it’s thicker brother did.
I guess it just shows how valuable your work is because we just can’t make any assumptions.
Hey Jak,
Yeah this one was pretty low across the board.
I Just finished another 360mm slim rad, it was weaker than the SE with low speed fans, especially in Push Only, but turned out to dominate in the high speed fans because it has a very high FPI count.
I used to try and make predictions, but but doing so can be dangerous, as the predictions can slip easily into assumptions, which in turn tend to make you look for patterns in the data which may or may not end up being there. At this stage you’re questioning the validity of the results, and do a retest, only to get the same results.
Better for sanity’s sake to accurately set the test parameters, and then trust the data that is logged.
Comments are closed.