


This first table shows the CG360’s Watts/10 Delta Temp numbers in a quick glance table format:

Using the data compiled from the Coolgate CG360 thermal testing I have compiled the following tables in an attempt to show other ways of how its performance varies against itself at the flow rates and fan speeds tested. Effectively these show percentage gains relative to a reference point. It’s an interesting way to show gains/losses while changing a variable.
First let’s focus on 1300 RPM as our reference and see how much gain or loss in performance we get by changing fan speed.

Pretty consistent and with a decent amount of responsive to fan speed. In the next plot we focus on changing the flow rate with 1.0 GPM as the base line.

Even at 1850RPM the flow rate has only a small effect on the CG360. How about we combine both flow rate and fan speed as reference points and have a look at 0.5 GPM & 750 RPM as the reference point.

Here we can see just how much airflow matters more than coolant flow for this radiator. Lastly, we change the reference and choose our center 1300 RPM and 1.0 GPM as our reference point to show both effects concurrently:

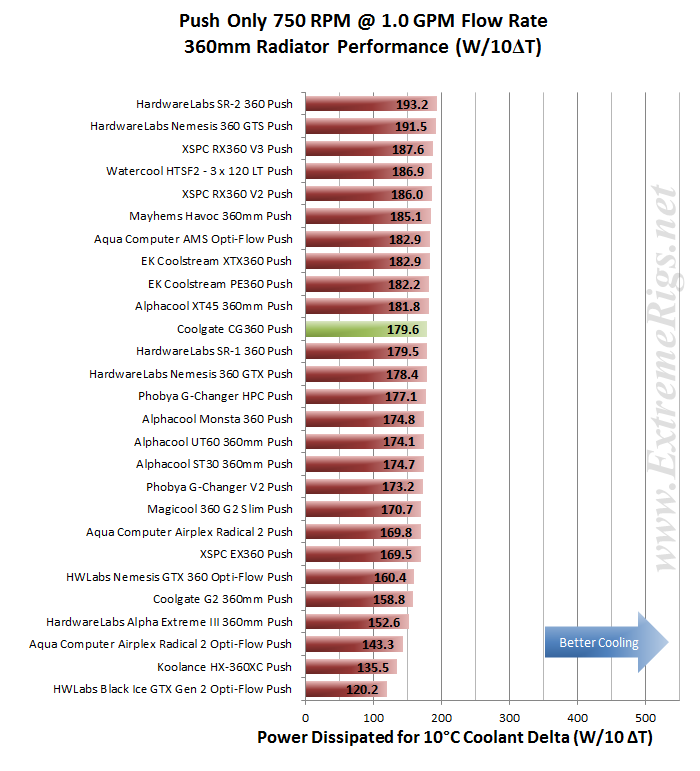
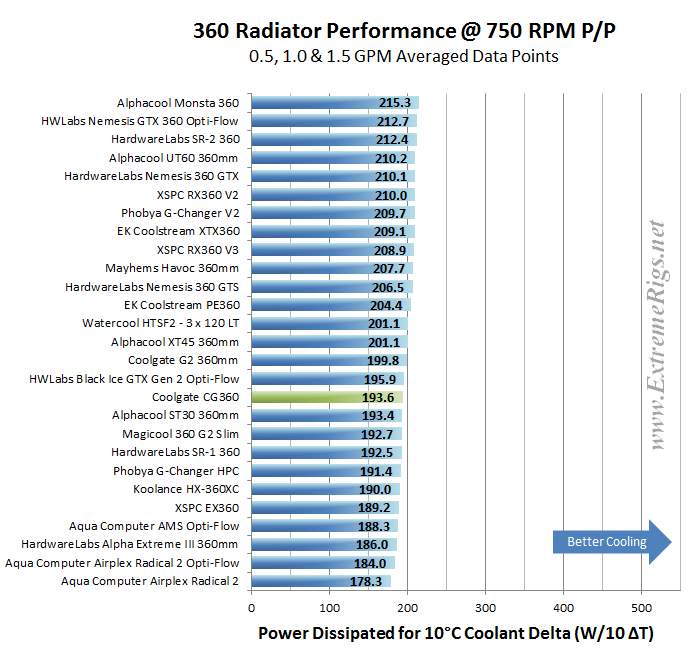
So from the data above we can get a very good idea of how the CG360 radiator performs relative to itself. But there is a large selection of 360mm radiator models to choose from, released from numerous manufacturers. So, we need to start comparing performance between them. To see how the CG360 performed against the other radiators tested, I have included the averaged flow rate comparison charts from the Round Up. We know that the flow rate has little impact on thermal performance so averaging of the 3 flow rate results gives us a good look at head to head performance at the rpm speeds tested at with even less error. Let’s focus on the Push Only results for now and come back to the Push/Pull data later. While for Push/Pull we tested three flow rates, the Push Only testing was conducted only at 1GPM in order to save time.
Let’s start with 750 RPM and see how it compares to the competition:

The CG360 finishes just outside the Top 10 in the Push Only rankings, ~ 7% behind the winning rad.
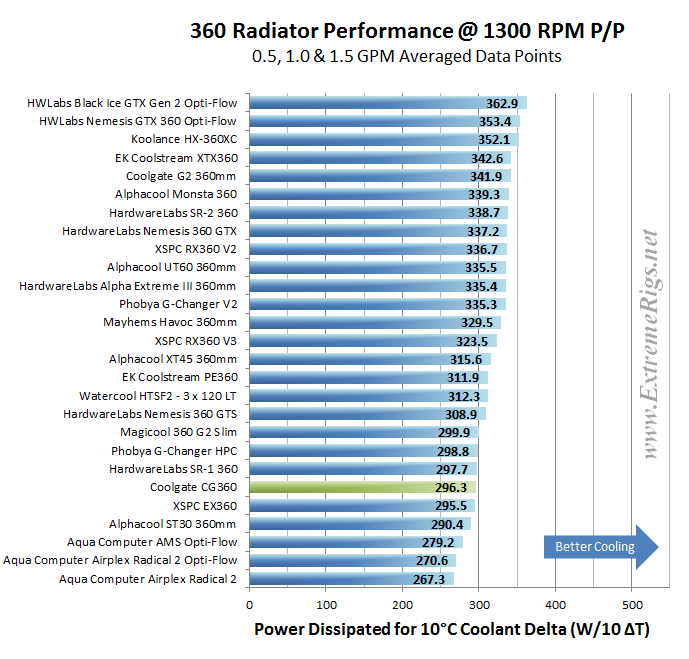
How does the CG360 do at 1300 rpm?
 The CG360 takes a dramatic drop in the 1300 comparison rankings, now ~11% behind the winner.
 At 1850 Push only the CG360 holds pretty steady in rank and percentage behind the winner.
So it appears (as expected) that the CG360 is tuned best for low fan speeds and the Push only testing is where it should have had its best comparison results given that it’s so low in FPI. Let’s now look at the Push/Pull results and see how the CG360 compares.

The CG360 finished in the middle of the pack in the low fan speed category, ~10% behind the winning rad. While not a poor result, this is most likely as high as the CG360 will place in the Push/Pull rankings.
Let’s move to the 1300 rpm:

In the 1300 rpm category the CG360 has dropped down the leader table to finish in 20th of the 25 radiators tested. It is now ~18% behind the category winner.
The averaged 1850 rpm results:

At 1850 Push/Pull the CG360 pegs back a few places but percentage behind the winner continued to drop, now ~22.5% behind the winner.
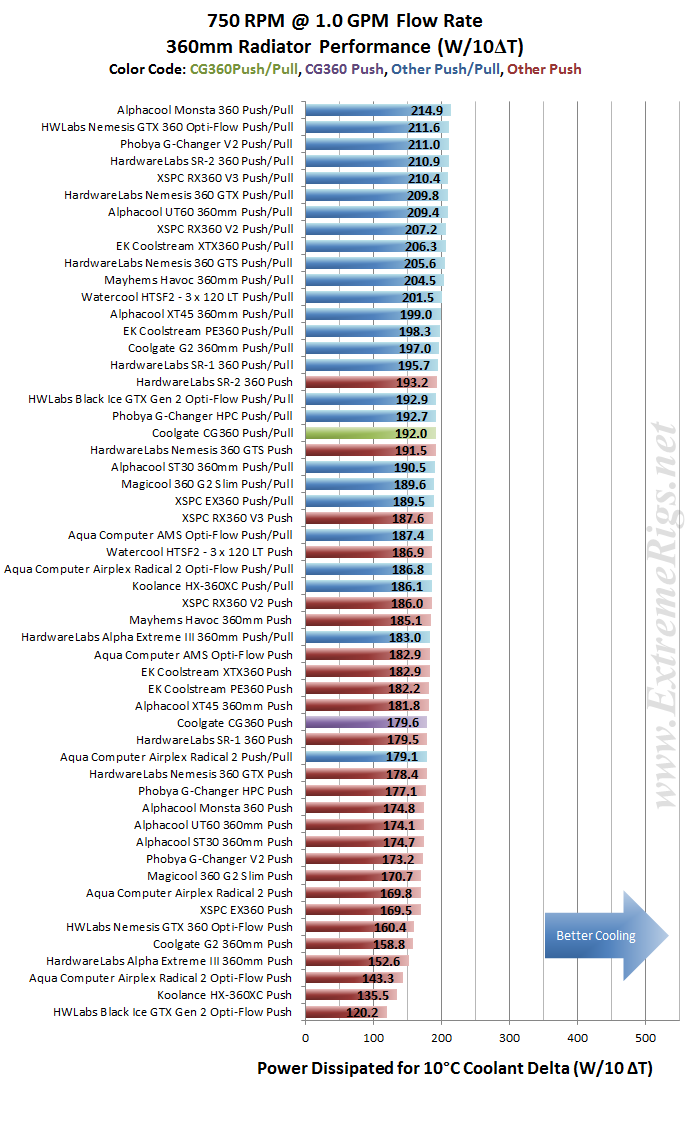
We can also combine the Push and Push/Pull results at the 1.0 GPM flow rate into one plot for each fan speed tested. This can be confusing so color coordination is used to distinguish push vs push/pull setups. Again the 750 rpm first:

Nothing looks out of place here given the data we have reviewed already. The Push/Pull result was beaten by the top performing Push Only rad.
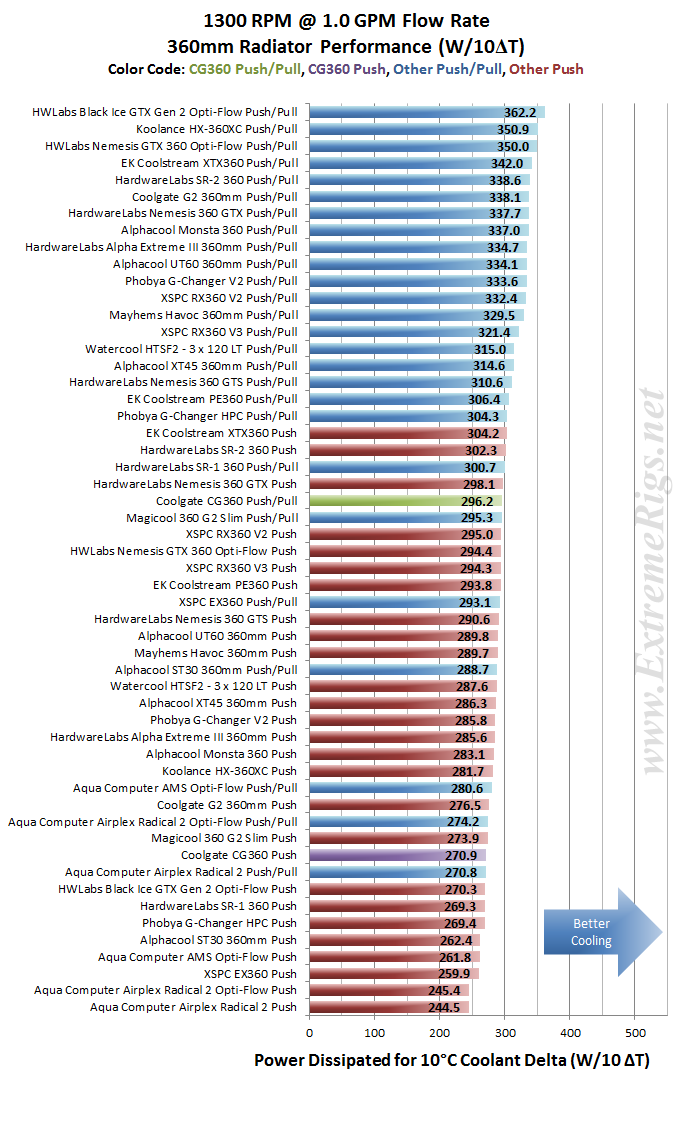
At 1300 rpm:

At 1300 a couple more of the Push only results have overtaken the CG360 at Push/Pull.

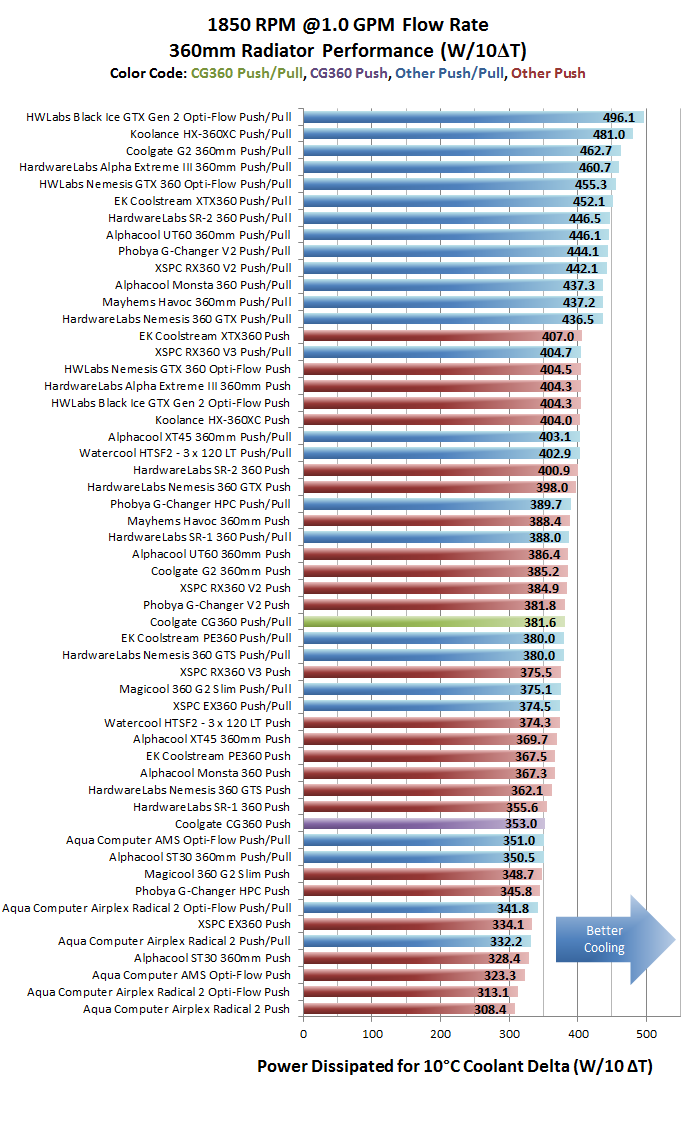
And at 1850 rpm we see that the weaker results of the CG360 are pushing it further down the list with nearly half of the other radiators’ Push only results beating its Push/Pull result.
From all of the test results we created “Average Performance Factor” charts for both Push and Push/Pull and then a combined plot called the “Master Performance Factor”. The radiator with the best cooling ability (W/10ΔT) at each gpm/rpm combo was awarded a score of 100, and each other radiators W/10ΔT result was scored as percentage of the top performer.
Here is the CG360’s percentage scores at each data point that thermal tests were conducted at:

The large proportion of low numbers and red boxes confirm what was shown previously, that the CG360 is not one of the top performers in the heat dissipation department. The 750rpm percentage numbers do appear better and that is where the CG360 did perform better comparatively, but it must be remembered that all the numbers are low in this category, so the percentage numbers will be much closer also.
These results were then averaged to produce a score for Push Only and another one for Push/Pull. This way of looking at the comparison takes away any advantages that a radiator may have at higher or lower fan speeds and looks at an overall average. While this appears fair it does tend to favor those radiators that are all-rounders and those radiators which do very well at high RPM. Most users should be more focused on their specific use case. Check in the Round Up for performance comparisons at every gpm/rpm combo for even more details and cross comparison results.
Firstly the Push Only APF:

The CG360’s Push Only APF of ~87% is respectable enough and puts it in the middle of the pack.
Now the Push/Pull APF:

The Push/Pull APF places towards the bottom of the pack, placing amongst the slim radiators of the group and the weaker performing finned tube rads.
Finally we created the Master Performance Factor which is calculated from the averaged results of all the thermal tests: Push Only and Push/Pull at all flow rates and all fan speeds:

In the Master Performance Factor comparisons the CG360 places in the lower half of the field. This is right about where one might hope it to place. If we consider the core design (thick with low FPI) it was never going to be a killer radiator at high fan speeds, but the Push only and low fan speed Push/Pull results were just good enough to stay respectable.
Next up – Summary!


[…] XT45 360 Radiator AquaComputer Airplex Radical Copper 360 Radiator AquaComputer AMS 360 Radiator Coolgate CG 360 Radiator Coolgate G2 360 Radiator EK SE 360 Radiator (Coming Soon) EK PE 360 Radiator EK XTX 360 Radiator EK […]
Comments are closed.