


The Thermal Data
Moving on from the restriction test bench the Alphacool Monsta 360 was loaded into the thermal test chamber for a series of 9 tests – consisting of 3 flow rates, each having 3 different fan rpm rates tested. I felt the thermal test data was most important and which you as the reader would be most interested in.
Below is the final data results gathered from at least 2 data logging runs at each flow rate and fan rpm combination. The most stable 15 minute period from each logging run was used and then averaged with the other runs to obtain the data for the table below. A total of 16 temperature sensors were used in the thermal test chamber (8 air in, 2 air out, 3 water in, 3 water out) each take a reading every second and logged via a CrystalFontz unit. The data in the table below is the result of the logging runs which has then been used to create all the plots and tables there-after.
The performance metric of critical importance is the delta between the warm coolant temperature in and the cold ambient air temperature in to the radiator. Given that the system is well insulated and in equilibrium and we know the heat input to the system then we can also calculate a very important number – that is the amount of power required to raise the coolant temperature 1C (or 10C which is more useful reference point).

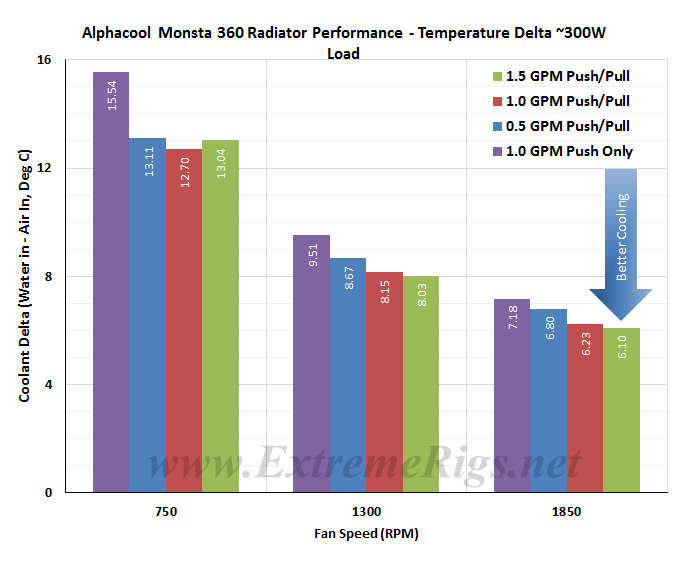
Like the vast majority of the other radiators tested, the Monsta 360 cares little about flow rate for thermal performance when run in Push/Pull, particularly above 1.0GPM.

In this bar chart the 1.0gpm 750 rpm P/P results shows that it has a lower delta temp than the 1.5 gpm rpm tests – this is misleading because the pump power is also higher at 1.5GPM – this explains why the W/Delta T numbers are still better at 1.5GPM.
So the performance is not greatly affected by varying flow rate. However Delta T is not always helpful when thinking about how many radiators you would need to cool your system. Instead it’s more useful to know the delta/W, or more usefully, the inverse metric of W/delta C. The metric plotted below tells us how many watts are dissipated by the radiator when the coolant rises 10C above ambient temperatures (10 Delta T). This calculation also factors in the varying ambient temps during the tests, so is a true measure of the actual heat dissipation performance of the radiator.
 As expected increasing airflow through the radiator is the primary determinant in changing the radiators performance. We can see that the lower Delta temps in the previous Delta Temp plot did not translate into better performance for the 1.0 GPM Push/Pull at 1300 RPM, but it is interesting how close all the results are at the low fan speed.
The Monsta has produced some impressive results here as the data comparisons later will show.
This data can now be plotted as a pretty curve so that an end user can interpolate their own fan speed. Note again that the extrapolation of the curve is much more sensitive to error than in between the tested range. Let’s exclude the push data for now and come back to it:
 This makes it easier to see that at higher fan speeds that a low flow starts to impact the cooling performance. This makes sense if you take it to the extreme and think about a very low flow rate where the coolant is already cooled 99% of the way to ambient with 10% of its journey through the radiator. In this example the radiator is not being efficiently used. 90% of the radiator surface area would then be wasted and you could have used a smaller radiator. Both coolant flow and air flow can limit thermal performance, however in typical systems flow is a much weaker effect than airflow due to typical choices of fans and pumps.

If we now come back to the push data it’s good to compare only the push to push/pull data in an “apples to apples” fashion by only looking at the 1GPM data:
Push gives around 85% (averaged) of the performance of Push/Pull across the range tested on this radiator. If you do combine all the plots you’ll also see that at high enough air flow that 1.0GPM Push would overtake 0.5GPM Push/Pull as the flow rate starts to limit performance.
Having said all of this about flow effects they are in reality small. So in this next plot all three flow rate results were averaged together to produce one curve. Averaging reduces test error of course so this helps further to be sure of our data and is more useful therefore for comparing to other radiators.
Here one of the top performing and worst performing rads have been plotted also to see how the Monsta 360 compares against them. As you can see the Monsta performs better in at low fan speeds against the Koolance, but drops off as the fan speeds increase.

Now let’s analyze that data.


[…] Alphacool Monsta 360 Radiator Alphacool ST30 360 Radiator AquaComputer Airplex Radical Copper 360 Radiator AquaComputer AMS 360 Radiator Coolgate CG 360 Radiator EK SE 360 Radiator EK XTX 360 Radiator EK XE 360 Radiator Hardware Labs Black Ice GTX 360 Radiator Hardware Labs SR2 360 Radiator Phobya G-Changer HPC 360 Radiator XSPC RX v2 360 Radiator […]
[…] […]
[…] the thickest 280mm radiator of our test group. We saw some interesting and unexpected results when we reviewed the Monsta 360 last year. The 280mm version only has ~10% less surface are than the 360, so might come up with […]
Comments are closed.