


HardwareLabs Nemesis 360 GTX Radiator Review
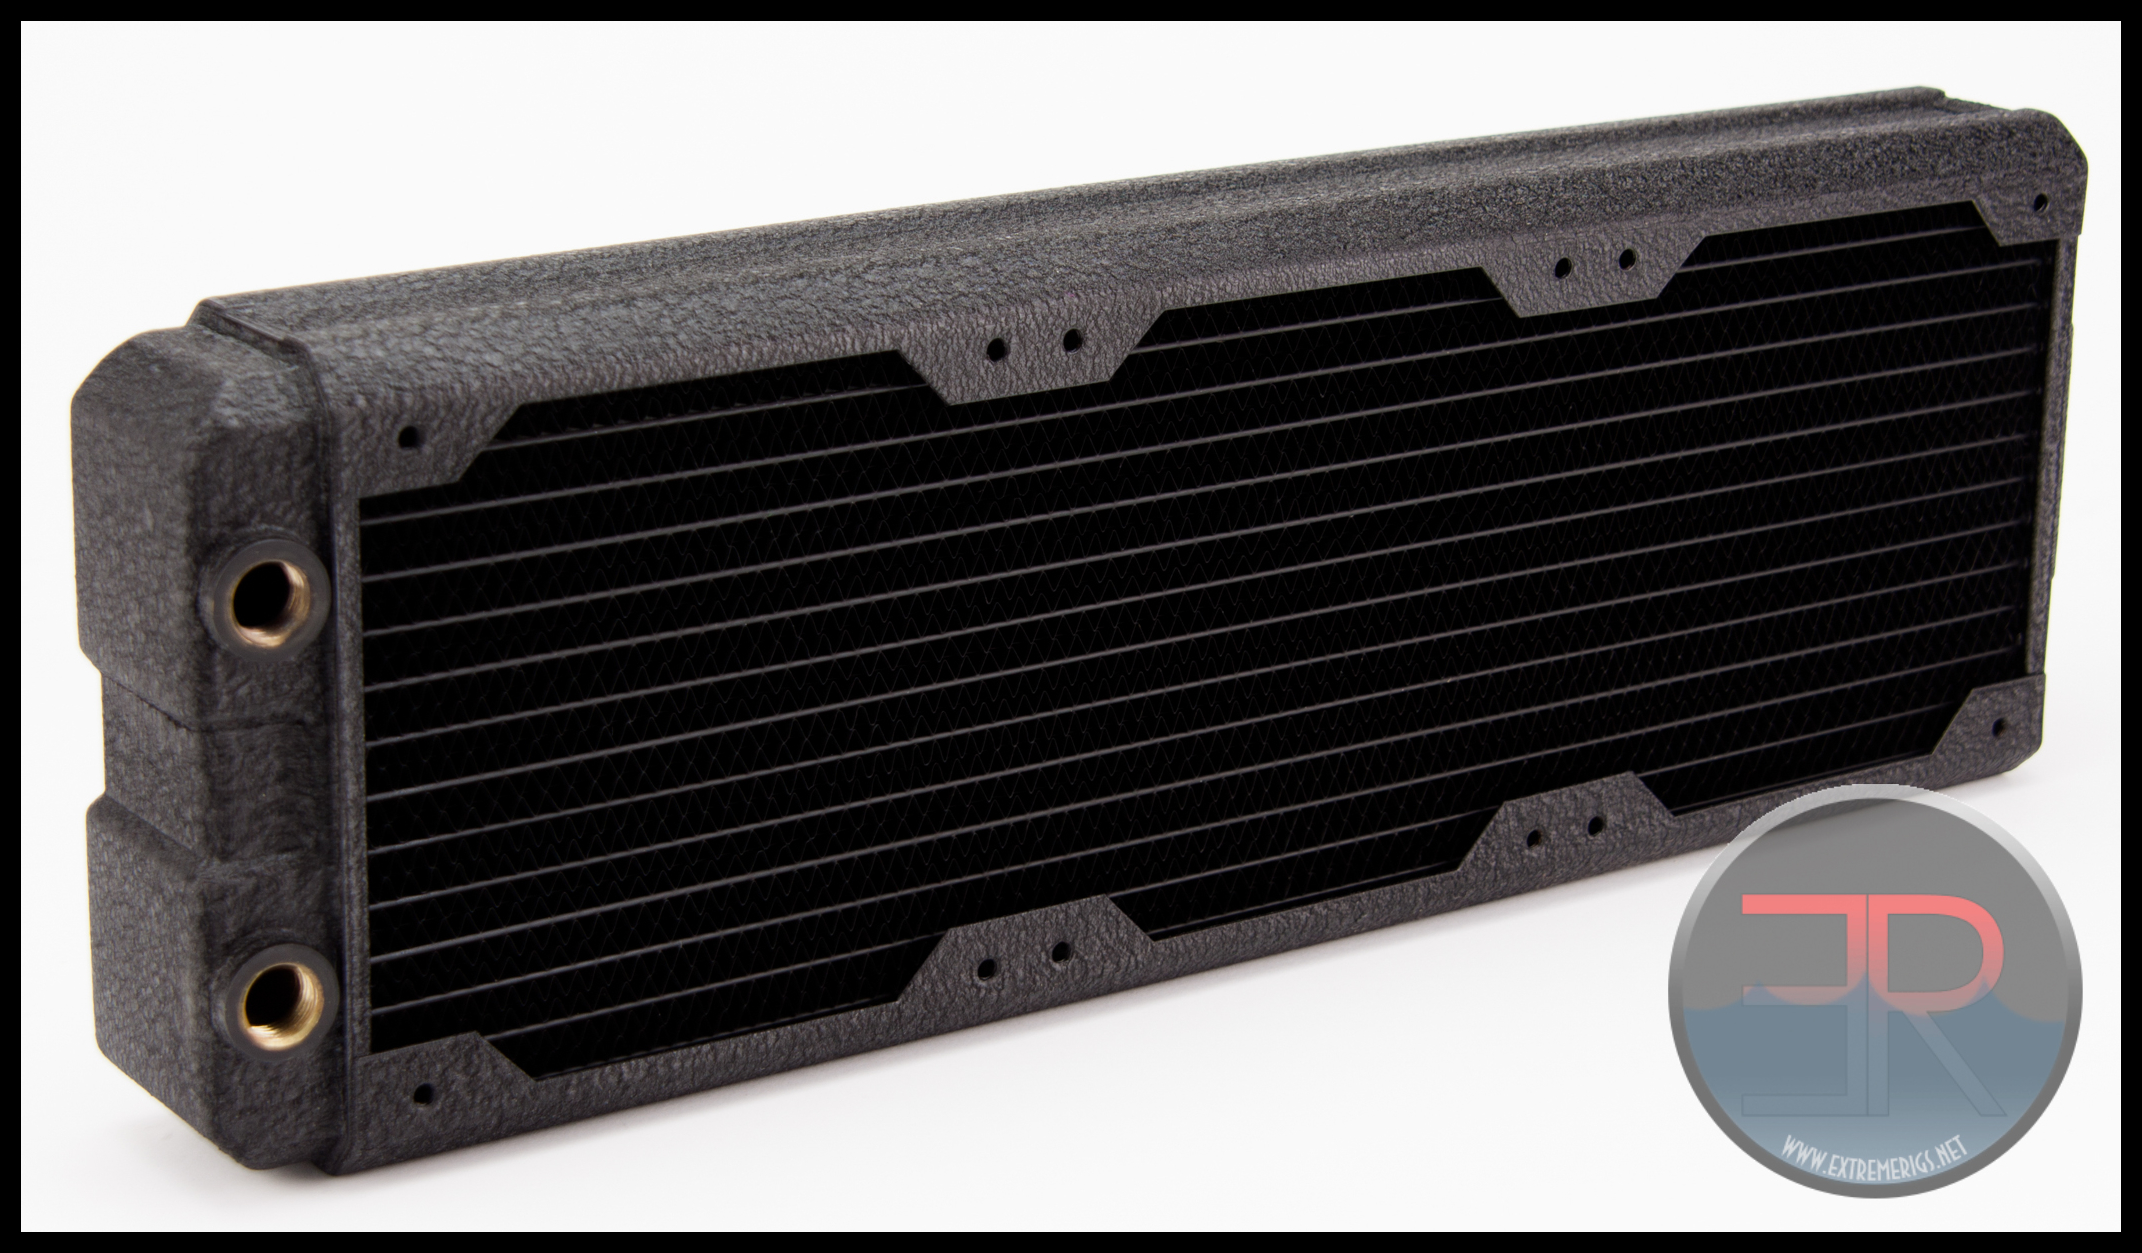
The intention of this radiator review is to provide information and performance data about the HardwareLabs Nemesis 360 GTX Radiator for inclusion in the Extreme Rigs Rad Round Up 2015. I’ll be keeping the review section short and factual, focusing on presenting the performance data compiled through the numerous tests carried out. First of all a big thanks to HardwareLabs for providing this sample of the Nemesis GTX.
![]()

What’s in the box?
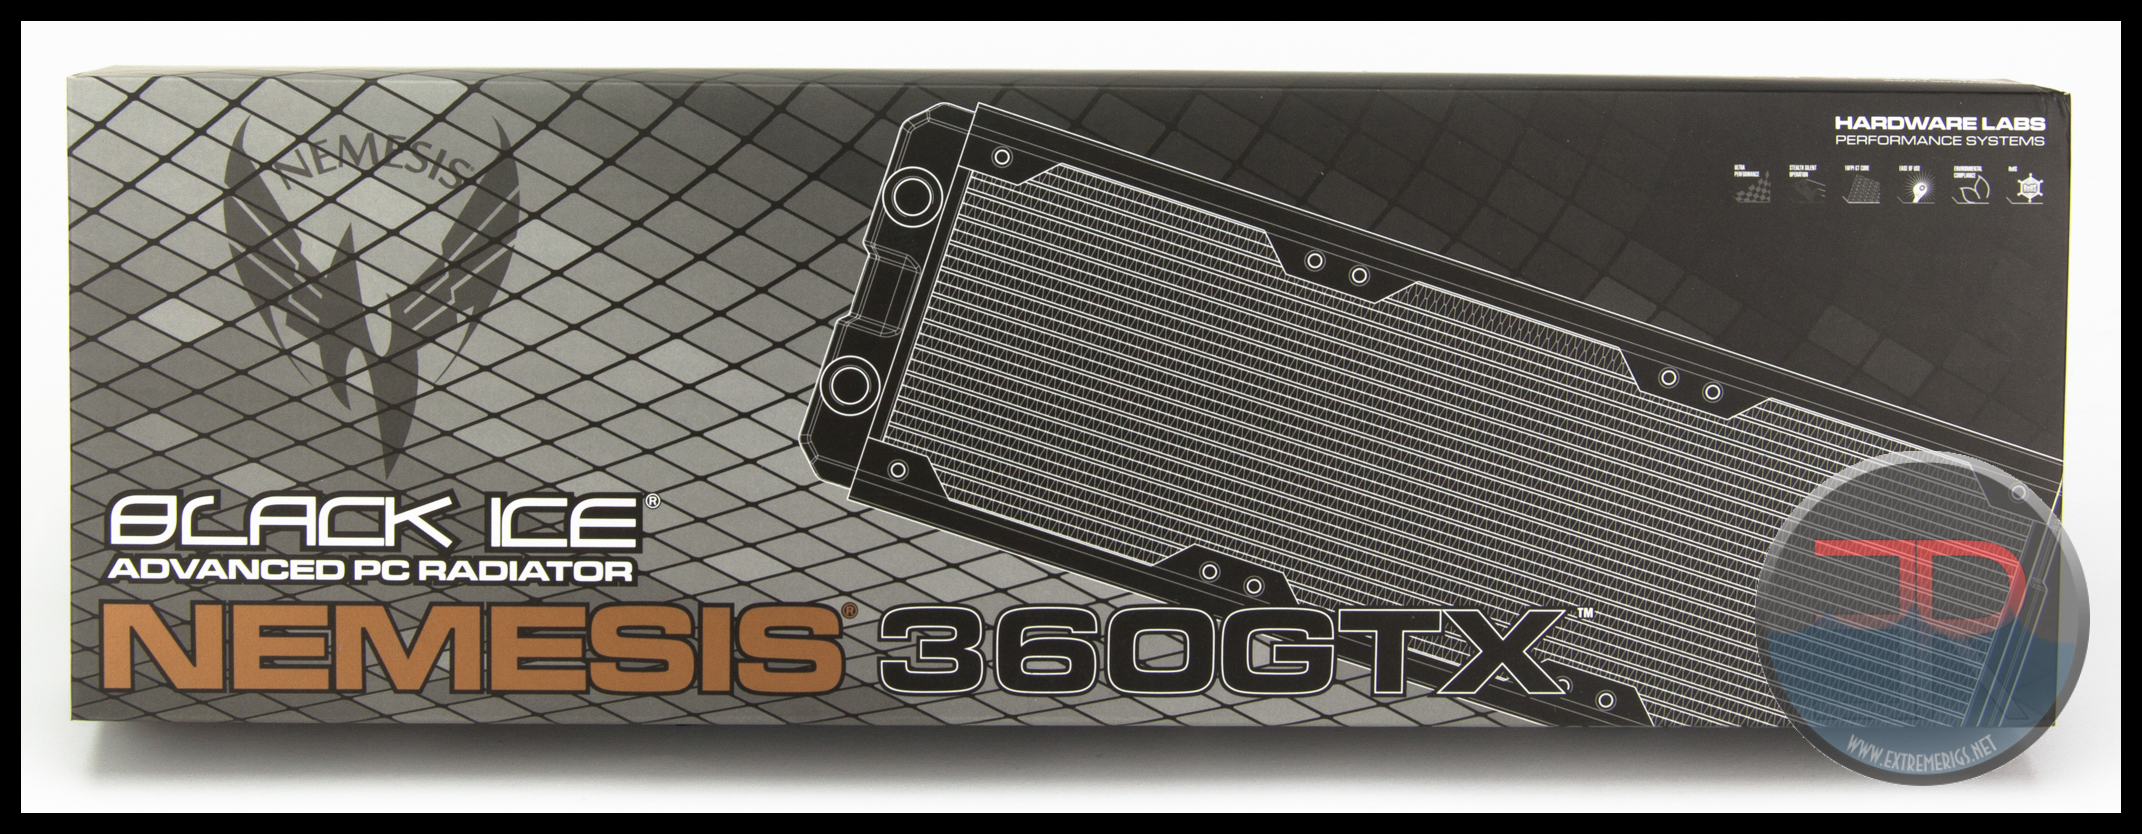
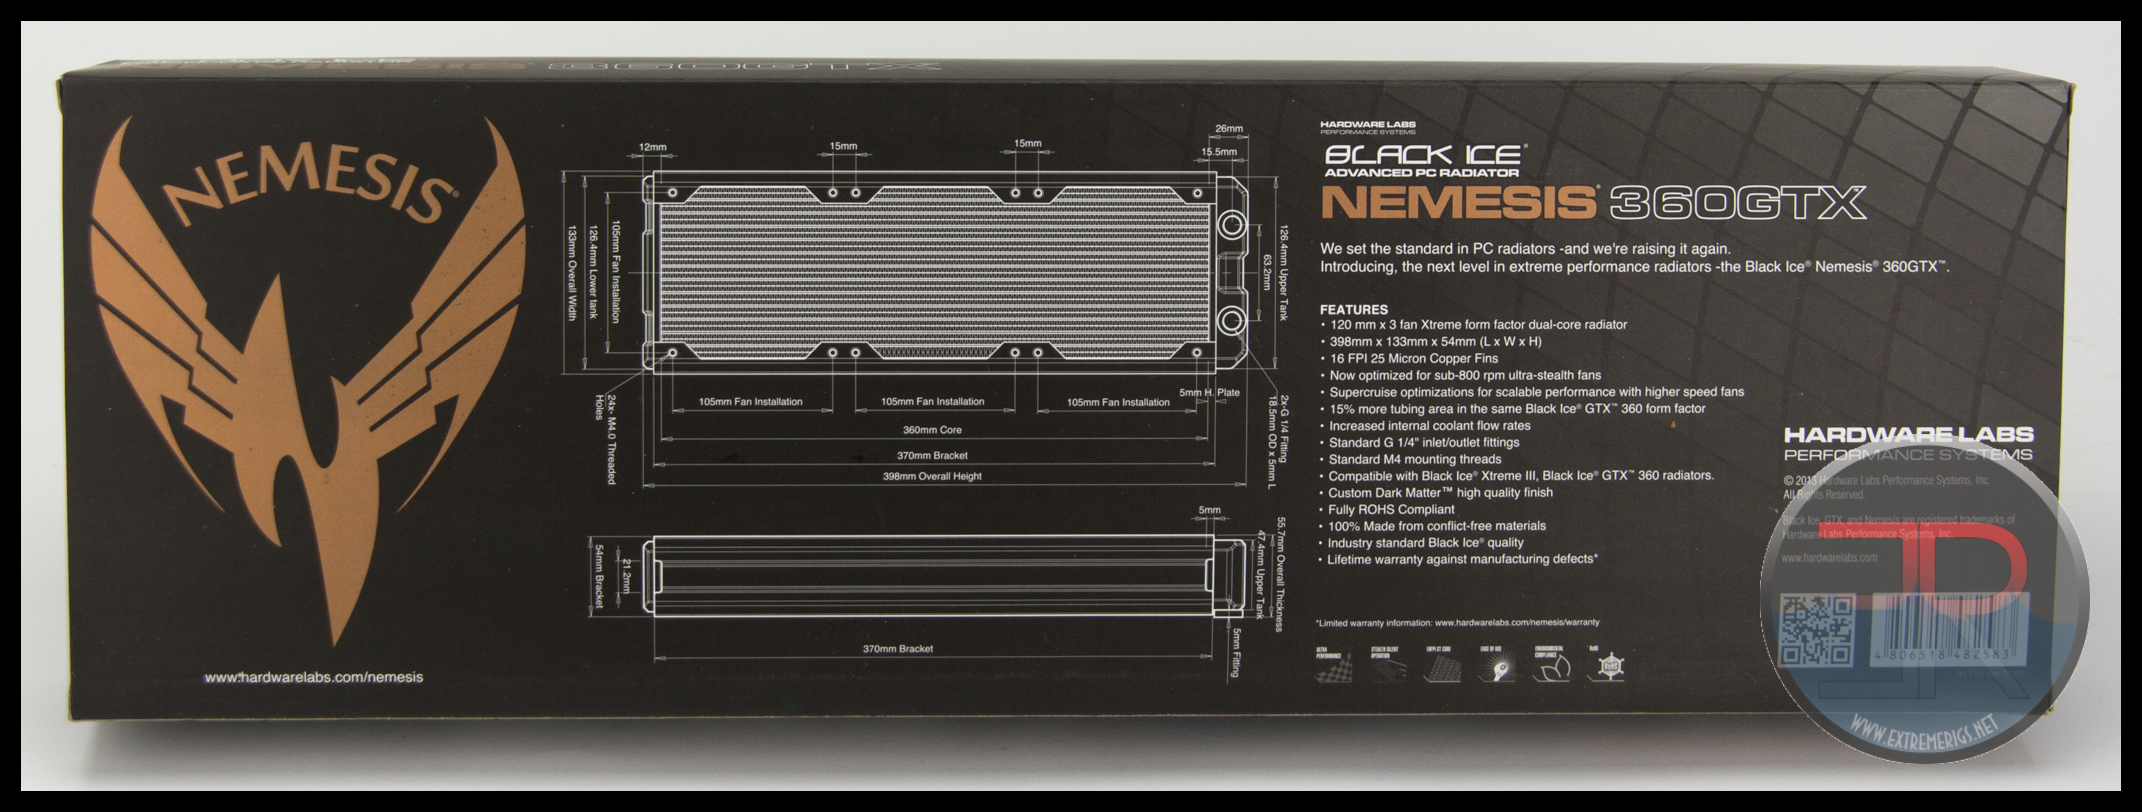
The Nemesis 360GTX sample sent by HardwareLabs came in full retail packaging. The front of the outer sleeve leaves us in no doubt as to what is inside. On the back we find some tech drawings and list of features.

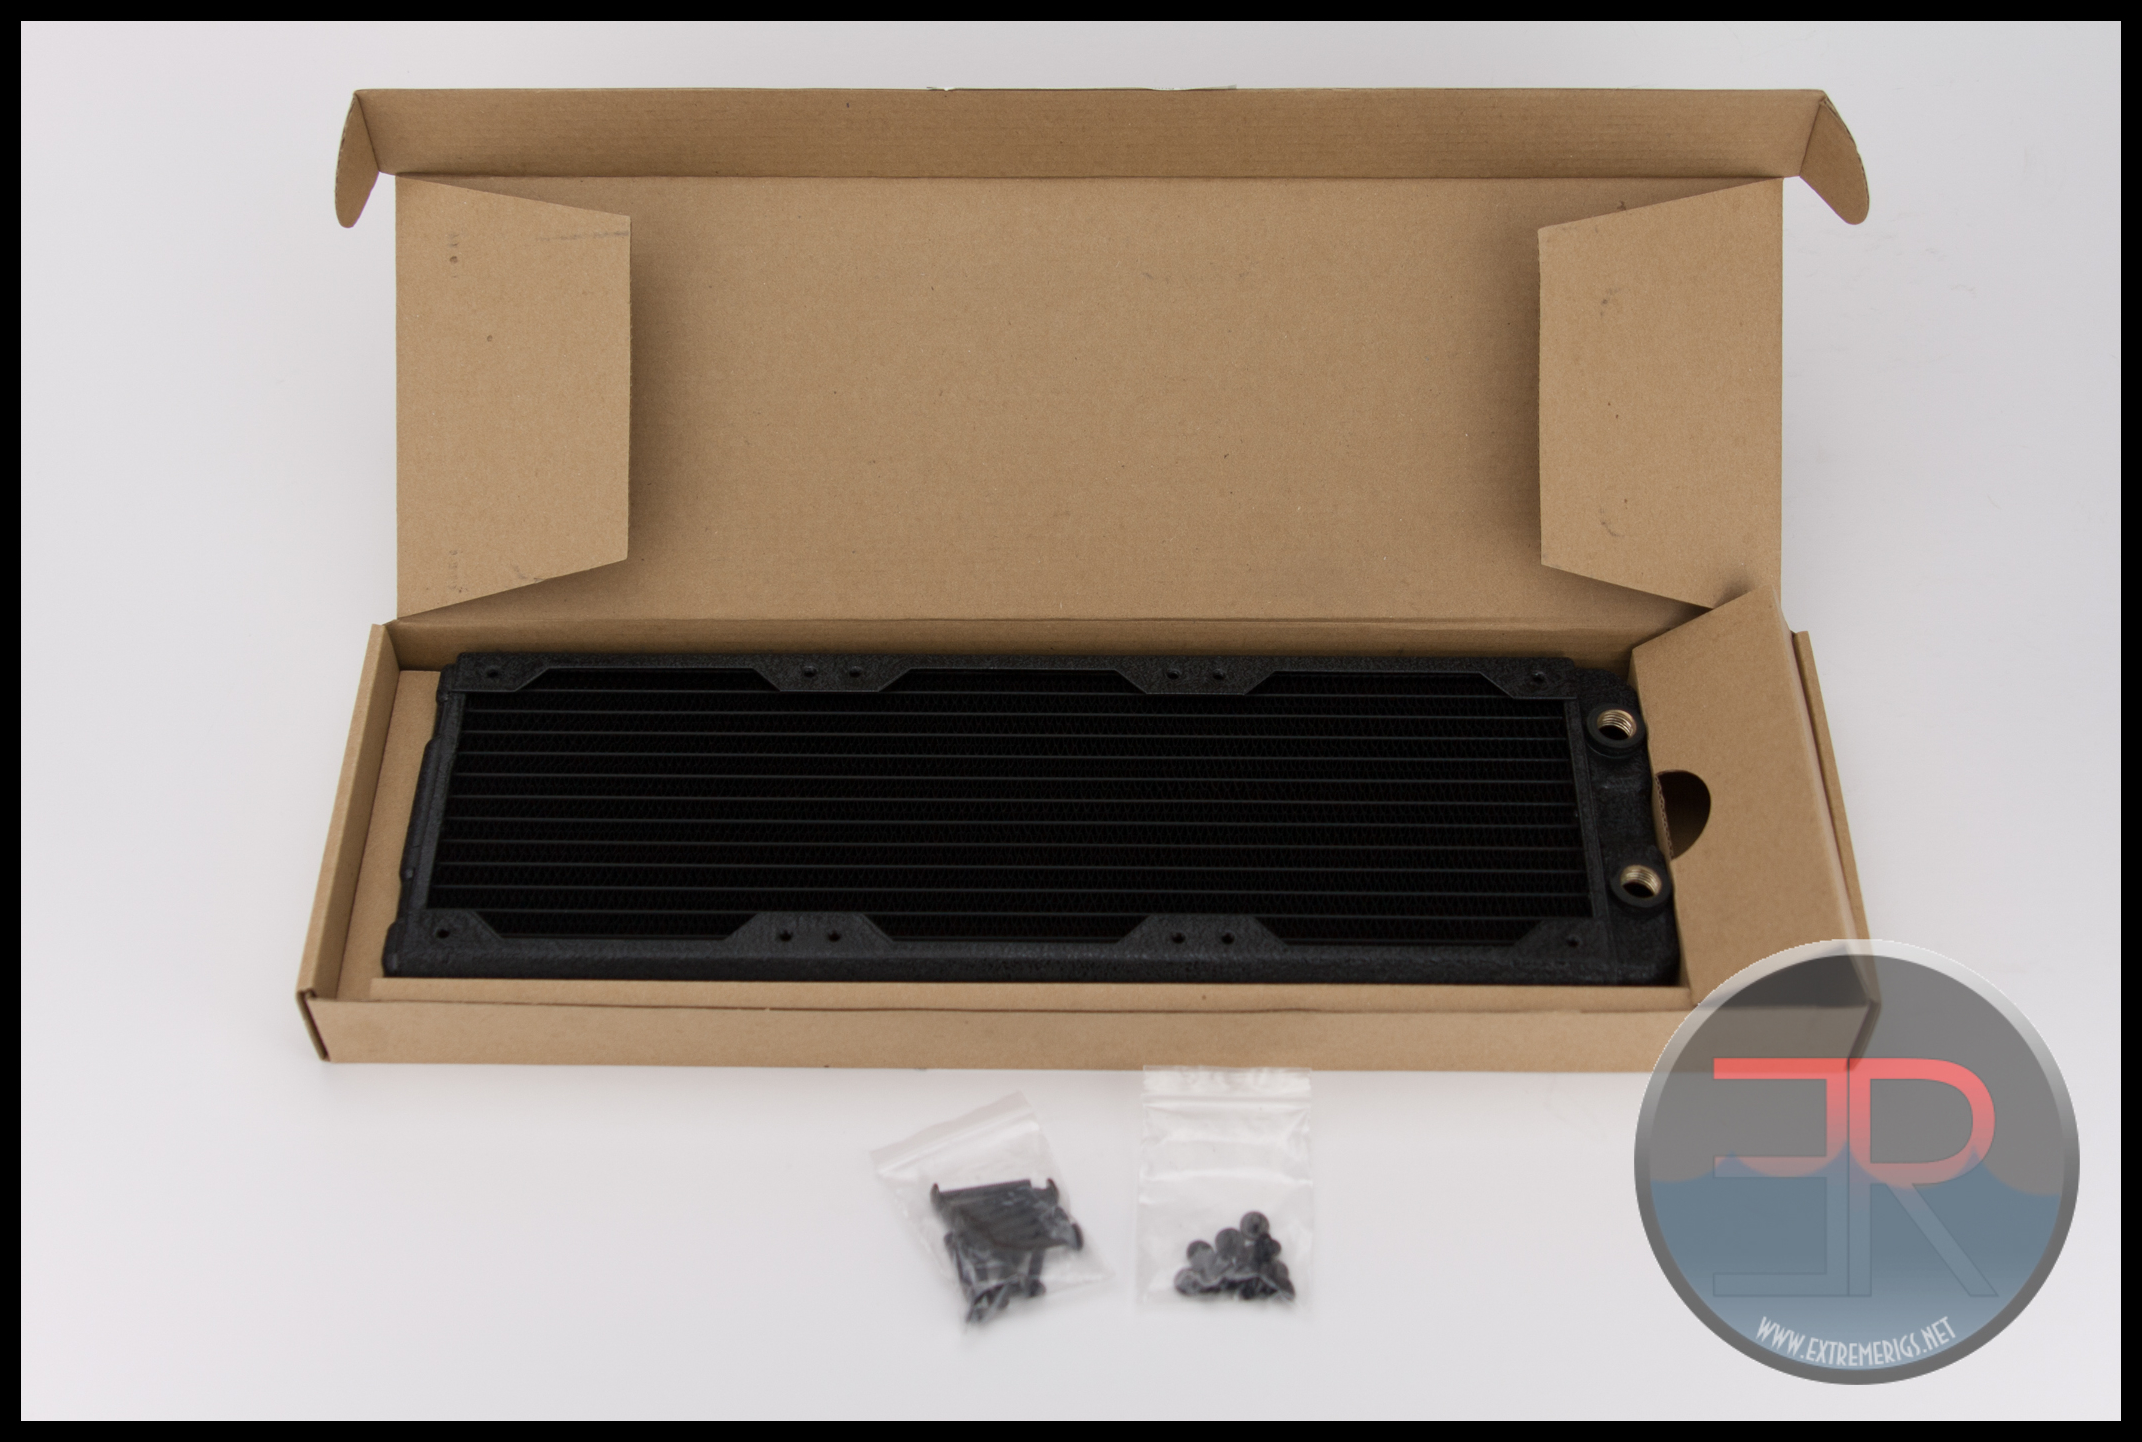
Removing the outer sleeve we find a sturdy shipping box with a sticker seal that gives us a warning about using correct length screws.


The lift up flap at one end for the screw is perfect, keeping the screws away from the precious core.

Extent of Delivery:
1x Radiator
12x M4 x 28mm black Phillips slotted pan head screws.
12x M4 x 5mm black Phillips slotted pan head screws.
Onwards to technical specifications!


[…] III 360 Radiator Hardware Labs Black Ice GTX 360 Radiator Hardware Labs Nemesis GTS 360 Radiator Hardware Labs Nemesis GTX 360 Radiator Hardware Labs SR-1 360 Radiator Hardware Labs SR2 360 Radiator Koolance HX-360XC 360 Radiator […]
When compared with the Nemesis GTS radiators, the Nemesis GTX radiators have the same 16 FPI (slightly less in this case), with essentially twice the core thickness and tubing length. Therefore it doesn’t make any sense that they would perform worse than the GTS at 750 RPM in the push only test.
It also doesn’t make sense that the GTS X-Flow performs significantly lower than the standard GTS at 750 rpm. Xflow radiators do perform slightly worse than their Uflow counterparts but not to this extent.
Nemesis 360 GTX Opti-Flow Push@750 rpm – W/10DeltaT= 160.4
Nemesis 360 GTS Xflow Push @750 rpm – W/10DeltaT = 161.1
Nemesis 360 GTS Push @750 rpm – W/10DeltaT= 191.5
So what is happening here?
I’ve noticed that there are no wattage values provided and no mention of how you’ve calculated heat resistance. On the graphs you’ve blanketed the results under a “~300W load” label. The lack of wattage results along with the vague “~300W load” label suggests to me that the power of your heater isn’t being kept constant.
Note: I do not know how you’ve calculated thermal resistance but I presume that you’ve averaged power data over time and used that value (please correct me if I’m wrong).
Working backwards from your results, I’ve calculated some of the wattage values.
The wattage of your heat source can be calculated by dividing Delta T by thermal resistance.
360 Nemesis GTX Opti-Flow results
Push@750 rpm
Delta T – 14.70
Delta T/W – 0.0623
W = 14.70 / 0.0623 = 235.95 W
@1300 rpm
Delta T – 8.61
Delta T/W – 0.0340
W = 8.61 / 0.0340 = 253.23 W
@1850 rpm
Delta T – 6.43
Delta T/W – 0.0247
W = 6.43 / 0.0247 – 260.32 W
From these results it is apparent that the wattage from your heat source varies and therefore so must the heat output.
Have a look at the 750 rpm reverse flow results.
Push@750 rpm = 15.38 / 0.05261 = 274.15 W
Push@1300 rpm = 9.15 / 0.0335 = 273.13 W
Push@1850 rpm = 6.74 / 0.0251 = 268.52 W
You can see that wattages are higher for this set of results and thus more heat is being input to the system by the heater. Therefore the results for W/10DeltaT are now higher than they should be relative to the Opti-Flow results.
Because of this, we cannot directly compare the two data sets unless we make the heat load constant for both sets of results.
Now how does this relate to the 360 GTS and 360 Xflow radiators? Do they experience the same heat load in these tests?
Nemesis 360 GTS Push @750 rpm = 14.62 / 0.0522 = 280.07 W
Nemesis 360 GTS Xflow Push @750 rpm = 15.31 / 0.0621 = 241.54 W
Nemesis 360 GTX Opti-Flow Push @750 rpm = 14.70 / 0.0623 = 235.95 W
The answer is no, and here in lies the problem with most of these results.
Comparing a radiator dissipating a 280W load to a radiator dissipating a 235W and 241W load is not a fair comparison as one has more heat available to dissipate than the others.
There is a 44W difference between the GTS and the GTX radiator. By comparison there is 39W difference between the GTS and the Xflow radiator.
This shows that the GTS radiator is being subjected to significantly more heat than both the GTX and Xflow radiators which explains why the dissipation is higher.
So how do we compare them? How much does the 360 GTX and 360 Xflow actually dissipate at 280W?
Since there are no data points for the GTX radiator at this wattage, we have to extrapolate from the current data points.
First we work out how much more of a heat load the GTS radiator experiences.
Relative to the 360 GTX – 280.07 / 235.95 = 1.187
Relative the 360 Xflow – 280.07 / 241.54 = 1.159
The GTS has a 1.187x (18.7%) higher heat load available to dissipate than the GTX.
The GTS has a 1.159x (15.9%) higher heat load available to dissipate than the Xflow.
Then by using the W/10DeltaT for these radiators at 750 rpm and multiplying it by the above values respectively, we can make the effective load the same for all three radiators. This should give us a better idea of how much each radiator is actually dissipating.
Nemesis 360 GTX Opti-Flow Push @750 rpm (235W load) – W/10DeltaT = 160.4
Nemesis 360 GTX Opti-Flow Push @750 rpm (estimated 280W load) – 1.187 x 160.4 = 190.4
Nemesis 360 GTS Xflow Push @750 rpm (241W load) – W/10DeltaT = 161.1
Nemesis 360 GTS Xflow Push @750 rpm (estimated 280W load) – 1.159 x 161.1 = 186.7
Nemesis 360 GTS Push @750 rpm (280W load) – W/10DeltaT = 191.5
We’ll also have a look at the reverse flow result at this rpm.
Nemesis 360 GTX Reverse Flow Push (274W load) @750 rpm W/10DeltaT= 178.4
Nemesis 360 GTX Reverse Flow Push @750 rpm = 15.38 / 0.0561 = 274.15
280.07 / 274.15 = 1.021 (2.1%)
Here, the GTS has a 1.021x (2.1%) higher heat load available to dissipate than the GTX.
Nemesis 360 GTX Reverse Flow Push @750 rpm (280W load) – 274.15 x 1.021 = 182.1
Comparing the results in this manner does assume that the rate of heat absorption remains the same under the higher load (though it will likely differ slightly). That said the numbers do give a better overall idea to the actual performance of the radiators.
As we can see there is now next to no difference between the watts dissipated per 10 degree delta, when comparing the GTX Opti-Flow and the standard GTS radiator.
We also see that the GTX Opti-Flow result outperforms the reverse flow result by ~9W dissipated.
The GTS Xflow result is now much closer to the standard GTS result only differing ~5W dissipated and this lines up exactly with how Xflow radiators perform relative to Uflow radiators.
But is this just all just a coincidence? After all these are extrapolations. These values were not measured at those wattages but instead were calculated estimates based on those measurements. And they are all showing me exactly what I wanted to see (logical sense).
In my opinion, its far more accurate to draw conclusions when you make these extrapolations than simply drawing conclusions from the results as they are presented currently.
I’ll compare the 280 GTX, GTS and Xflow radiators to these ones sometime in the next few days and we’ll see whether or not my method holds up. But in the mean time, feel free to depict anything incorrect with what I’ve said and I’ll be glad to discuss it.
Ok so first off – if we were to start this thing all over we would be doing it slightly differently as we learned things along the way. We still think we have the most accurate data out there simply because one of the things we learned was how hard it is to test radiators well. Now if it wasn’t going to take 18 months to retest everything we already would have started over.
So I’m not going to address everything in your post at this time because I think we need to start off with the same fundamentals of what the test is otherwise we can go around in circles with math.
So you mentioned the heater. The heater is a 300W aquarium heater totally immersed into a reservoir. The voltage was adjusted with a variac so that it was nominally using 300W in every test.
However because we change flow rates and pump power then there are a few more variables than we would like. Changing pump power adds more heat to the loop. Changing the flow changes the heat loss from the loop. Not all of the heat from the heater gets cooled by the radiator as some of it is passively dissipated. To fight this we insulate the tubes, but insulation isn’t perfect (particularly at higher temperature deltas) and there are various things which can’t be insulated like the flow mete.
SO after we realized just how large an effect this was we switched from simply measuring the deltas to compute the cooling to also having to also measure the power dissipation of the radiator every test. So yes purely looking at deltas in our test isn’t an apples to apples comparison. That is why we compute the W/DT because that is more apples to apples and we believe is a fair enough comparison. I think a better setup would be to keep the pump power fixed and allow flow to vary – this reduces any power contribution from the pump but the flow still varies slightly so passive heat loss still changes. I would also then switch to a less accurate flow rate sensor that can be insulated. However I think the large variation in delta T from varying fan speed also changes the passive cooling effect considerably because the insulation isn’t perfect. In our 750RPM tests, the coolant was often 15-20C over ambient which we would consider too high for a normal PC system. That cooling actually helps worse radiators to perform a little better because the warmer the coolant the more the benefit of passive cooling. I think a fairer comparison is to actually keep the Delta T constant at 10C and vary the heater power accordingly. However this still requires measuring the power dissipated by the system which is what really introduces error to the measurements and means we have to take weeks to take data on a single radiator. The power dissipation of the radiator is based off the coolant delta across the radiator which will often be ~1C, so to get a <1% error you're looking at measuring to an accuracy of <0.01C which is incredibly hard with the kinda of temperature probes we can afford.
So does this answer the questions on how we tested these radiators? If so then we can move on to the results themselves 🙂
Comments are closed.