


")
Introduction
XSPC EX360 360mm Radiator Review
The intention of this write up is to provide information and performance data about the EK CoolStream SE 360mm Radiator. We will be including the test results in the Extreme Rigs Rad Round Up 2015, however in this review rather than comparing the SE to all the rads we made a decision to start a Round-Up just for the Slim 360mm rads. Expect our Slims Round-Up to be published in the coming weeks.
I’ll be keeping the review section short and factual, focusing on presenting the performance data compiled through the numerous tests carried out. The EX360 is “End of Life” now, but some e-tailers still have stock available at clearance prices.
![]()

What’s in the box?
Note: The radiator tested was pulled from my water cooling stash, but had no accessories in the box anymore.
Additionally: Some years ago I modified this rad to have G ¼ ports on both sides of the tank. The stock EX360 has just one inlet and outlet port.

XSPC have packaged the EX360 in a sturdy protective box.
The radiator itself was wrapped in white paper sleeve and then inside a bubble wrap bag. The paper sleeve was long gone but I recall that it was there. The accessories were unfortunately no longer inside the box either. Again this radiator was in storage and pulled out for the round up, so I apologize for lack of pictures and somewhat sketchy info – it is included primarily for the thermal testing data.

Extent of Delivery (according to XSPC):
1x EX360 Triple Fan Radiator
12x 30mm 6-32 UNC screws (Phillips head)
12x 6mm 6-32 UNC screws (Phillips head)
I recall that it did come fitted with temporary yellow plastic plugs in the G ¼ ports, to keep the inside contaminant free after manufacturing.
Here is a photo I found on the web:

Onwards to technical specifications!
Technical Specifications
Technical specifications as listed by XSPC:
- Copper and Brass Core
- Black Matt Paint Finish
- RoHS Compliant
- Dimensions: 121 x 35.5 x 395mm (WxDxH)
- Weight: ~663g
- Ports: G1/4″
- Screws: 6-32 UNC
- Fans: 3 x 120mm (6x with push/pull)

Dimensions Measured on the radiator tested (retail unit):

Radiator Core Dimensions:

NOTE: The EX360 tested has been used previously and was modified by having additional inlet and outlet ports fitted on the port chamber opposite to the 2 standard ports that the EX360 comes with. The radiator is in excellent condition still and I feel that even with the additional ports fitted performance results will not be affected in any way.
The fin spacing is very uneven up and down the tubes which is not unusual for a dense fin structure. The fin installation could have been better; I might even go as far to say that it is rather poorly done.
XSPC chose to use a 9mm internal shroud depth on each side which is fantastic. Given the overall rad housing thickness measured 34mm, taking away 9mm on each side leaves us with a core thickness of just 16mm. This is possibly the thinnest core available on the water cooling market. It was definitely the thinnest core of the rads in the test group with the next closest being 20mm thick.

The EX has a dense fin count of 18 FPI (fins per inch) which was measured in numerous places on the core.

Finish and Features
The EX360 has matte black finish and my used sample was in pretty good condition still after having a major mod carried out on it and was installed in a system. All round the EX looks and feels like a quality unit.
The XSPC logo is stamped into both edges. There is only one input and one output port and there are no bleeder/fill ports.
Let’s see how it performs…
Flow Performance
The Data
As all the testing in this round up was performed with the exact same equipment, using the exact same methods I have decided to keep each radiators page uncluttered by posting our testing methodology, test set-ups and equipment used in a single location. To see exactly how the tests were carried out, details of the test set ups and equipment used, please head back to the RRU’15 Test Equipment Page.
Restriction Test
It’s generally agreed that radiators are one of, if not the least restrictive components in the water cooling loop. There are some exceptions however, so this must still be verified through testing:

Note: The picture above of the test set-up reference only, the EX360 is not loaded so please disregard the readings.
Here is the raw data at the tested flow rates, displaying the measured Differential Pressure across the radiator as flow rate was increased.
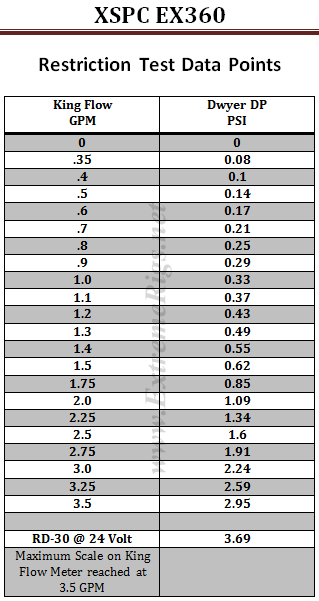
The table numbers indicate that the EX is a low restriction radiator. However numbers in isolation can only tell half the story. By plotting against other components it more easily shows the whole story.
I have decided to use a HeatKiller 3.0 CPU block as the reference in these plots for two reasons. Firstly there is no chance of the plot being cluttered by curves overlapping and secondly it gives a reference point against a fairly common loop component of average restriction.
As with all the radiator restriction plots I have limited the maximum flow rate displayed to 2.0 GPM as I suspect there are very few systems that operate above 2.0 GPM. For more information on how to read a restriction plot check out our guide.
 This plot shows us that the EX as a low restriction component. Let’s see how it fares against the other radiators in the test group.
Now that we’ve seen how the EX360 scales we can take some of those data points and make a comparison to the other slim radiators.
The next three plots show the EX’s restriction level relative to other slim radiators in the test group at 3 different flow rates – what we consider to be low, medium and high system flow rates.


From these tables it would be fair assessment to call the EX 360 a low restriction radiator when compared to the other slims, but before we make that conclusion let’s take a quick look at the restriction levels all our 360 rads at 1.0 gpm.
 So in the big picture of 360 radiators the EX 360 is a medium restriction rad, which shows us that sometimes it is better to look at the bigger picture rather than focus on smaller target groups before making assessments based on the data.
Onwards to Thermal Performance!
Thermal Performance
The Thermal Data
Moving on from the restriction test bench the EX radiator was loaded into the thermal test chamber for a series of 9 tests – consisting of 3 flow rates, each having 3 different fan rpm rates tested. I felt the thermal test data was most important and which you as the reader would be most interested in.
Below is the final data results gathered from at least 2 data logging runs at each flow rate and fan rpm combination. The most stable 15 minute period from each logging run was used and then averaged with the other runs to obtain the data for the table below. A total of 16 temperature sensors were used in the thermal test chamber (8 air in, 2 air out, 3 water in, 3 water out) each take a reading every second and logged via a CrystalFontz unit. The data in the table below is the result of the logging runs which has then been used to create all the plots and tables there-after.
The performance metric of critical importance is the delta between the warm coolant temperature in and the cold ambient air temperature in to the radiator. Given that the system is well insulated and in equilibrium and we know the heat input to the system then we can also calculate a very important number – that is the amount of power required to raise the coolant temperature 1C (or 10C which is more useful reference point).

Like the vast majority of the other radiators tested, the EX cares little about flow rate, particularly above 1.0GPM. Here are some plots to show the variance:

So the performance is not greatly affected by varying flow rate. However Delta T is not always helpful when thinking about how many radiators you would need to cool your system. Instead it’s more useful to know the delta/W, or more usefully, the inverse metric of W/delta C.
The metric plotted below tells us how many watts are dissipated by the radiator when the coolant rises 10C above ambient temperatures. (10 Delta T):

As expected increasing fan speed and therefore airflow through the radiator is the primary determinant in changing the radiators performance. This push/pull data can now be plotted as a pretty curve so that an end user can interpolate their own fan speed. Note that the extrapolation of the curve is much more sensitive to error than in between the tested range.

This makes it easier to see that at higher fan speeds that a low flow starts to impact the cooling performance. This makes sense if you take it to the extreme and think about a very low flow rate where the coolant is already cooled 99% of the way to ambient with 10% of its journey through the radiator. In this example the radiator is not being efficiently used. 90% of the radiator surface area would then be wasted and you could have used a smaller radiator.
Having said all of this in this next plot all three flow rate results were averaged together to produce one curve. This works well because the radiator was so flow rate insensitive. Averaging reduces test error of course so this helps further to be sure of our data and is more useful therefore for comparing to other radiators.

Lastly let’s compare the push vs push/pull data:

Here both fan setups are quite close together – this is not a surprise as most slim radiators seem to give little gain for push/pull setups.
Now let’s analyze that data.
Data Analysis
Using the data compiled from the EX360 thermal testing I have compiled the following tables in an attempt to show another way how the its performance varies against itself at the flow rates and fan speeds tested. Let’s first take a look at the raw W/10DT data we will be using:

We can then use this data to show percentage gains relative to a reference point. It’s an interesting way to show gains/losses while changing a variable. This first table shows performance gain or loss relative to 1.0GPM flow rate:

This shows that increasing flow to 1.5GPM has little gain while lowering flow to 0.5GPM does affect performance more.
We can also focus on 1300RPM as our reference and see how much gain or loss in performance we get by changing fan speed:

As expected the change is dramatic. Lastly we can combine both and choose 1300 RPM and 1.0 GPM as our reference point to show both effects concurrently:

So from the data above we can get a very good idea of how the EX360 radiator performs relative to itself. But there is a large selection of 360mm radiator models to choose from, released from numerous manufacturers. So, we need to start comparing performance between them.
Push Only Data vs Competition
Let’s focus on the Push Only results for now and come back to the Push/Pull data later. While for Push/Pull we tested three flow rates, the Push Only testing was conducted only at 1GPM in order to save time. For a comparison vs thicker radiators make sure to check out the 2015 Rad Round Up which compares 27+ radiators including the EX360.
Let’s start with 750 RPM and see how it compares to the competition:

Slim radiators often do best at low fan speeds in push. Our expectation therefore is that this result at 750RPM will be the EX360’s best result. However the FPI is reasonably high so let’s not jump to conclusions just yet.

At 1300RPM things are however looking worse.

At 1850RPM the EX moves back up a spot, but hardly makes a compelling case for itself.
So the EX360 was a below average performer compared to the competition with Push Only fans. As is the most likely installation scenario for this radiator the results were a little disappointing.
Even though Push/Pull fan assemblies are probably not what the intended use for a slim rad actually is (for most users) we tested it anyway.
So let’s find out how it fared…..
Push/Pull Data vs. Competition
Let’s now look at the Push/Pull results and see how the EX 360 compares. For Push/Pull we have averaged the results from the 3 flow rates at which we tested.

Again the EX360 is languishing near the bottom, although it must be pointed out that the 2nd to 5th place results are all very close, so in reality EX is not as far behind as the order makes it appear.

At 1300RPM the EX pics up a position, and the extremely high FPI Koolance rad has taken the lead.

At 1850 Push/Pull the EX again makes a positional improvement, due to it’s dense core structure, but the Koolance slim has streaked away with the win.
Well the EX360 is hardly a top performing radiator – but at least it never hit the bottom of any charts.
Let’s also combine the Push Only and Push/Pull results at the 1.0 GPM flow rate into one plot for each fan speed tested. These plots show just how well the best slim radiators performed against the competition, while showing the EX 360’s half decent performance.

The EX360 in Push/Pull is already overtaken the by the Nemesis GTS in Push at this low fan speed condition. There seems to be no reason to run the EX360 in P/P.

At 1300RPM there are now a lot of push options that would offer more performance than the EX360.

The trend continues at 1850RPM where if we are to be honest, we have better options to choose from in terms of performance, with the very high FPI Koolance Push Only result even beats the EX’s Push/Push result.
From all of these results we can create a “master performance factor”. The radiator with the best cooling ability (W/10ΔT) at each gpm/rpm combo was awarded a score of 100, and each other radiators W/10ΔT result was scored as percentage of the top performer:

So, as predicted the EX360 did perform best (relative to the competition) in the 750rpm (slow fan speed) testing. It’s results were not great by any stretch of the imagination, but that is where it was closest to the other radiators in the test group when looking at overall performance. We see that the EX’s comparative performance get’s worse as the fan speed is increased. Also noteworthy is that it’s high flow rate results appear to have performed better than the most of the test group as we see percentage gains across each of the fan speeds as the flow rate increases.
All these percentage scores were averaged giving us the Averaged Performance Factor of each radiator. This way of looking at the comparison takes away any advantages that a radiator may have at higher or lower fan speeds and looks at an overall average. While this appears fair it does tend to favor those radiators that are all rounders and those radiators which do very well at high RPM. Most users should be more focused on their specific use case. Check in the Round Up for performance comparisons at every gpm/rpm combo for even more details and cross comparison results.
Firstly – the Push Only APF:

In Push Only the EX360 finishes in 5th place by the slimmest of margins. It is clear that 4 of the slim rads all had similar performance , while there was one clear winner and one clear loser.

In Push/Pull the score is slightly better and the EX gains a position. Again the results in the middle of the pack are very close together.
Finally we created the Master Performance Factor which is calculated from the averaged results of all the thermal tests, Push and Push/Pull at all flow rates and all fan speeds.
 In the Master Performance Factor comparisons the EX 360 finishes in 4th place by the closest of margins.
Next up – Summary!
Summary
Summary
Thermal Performance
Thermal Performance scores are derived from the relevant Performance Factor scores. We set this scale with 72.5% and below as the 0 mark, with each 2.5% increase from 72.5% in relative performance adding 0.5 to the awarded performance score.
The Bold Scores are based on performance comparisons of only the slim 360mm Rads. On the second line is the score which is generated against all the 360mm rads from the complete round up.
Push Only Thermal Performance
- 3.5/5 – Slims Only 360mm rads.
- 1.6/5 – all 360mm rads
The EX 360’s Push Only thermal performance was good with out being exceptional. Its 89.0 comparative performance factor score equated to a Push only score of 3.0
Push/Pull Thermal Performance
- 4.0/5 – Slims Only 360mm rads.
- 1.4/5 – all 360mm rads
Another category, and this time we have solid performance from the EX 360. With a Performance Factor Score of 90.4 the EX gets a 4.0/5 for Push Pull Performance. Unfortunately, many users will not have room for Push/Pull fans if they are looking at slim rads.
Overall Thermal Performance
- 3.0/5 – Slims Only 360mm rads.
- 1.5/5 – all 360mm rads
With decent Push Only and Push/Pull results the ST30 generated a 89.7 Master Performance Factor score means that 3.0/5 score is the end result.
The XSPC EX360’s results were average across the board in our comparisons, so it seems fitting that a score of 3.0 was generated for it’s performance result. luckily it wasn’t the worst performer in the test, however it doesn’t make a strong case for itself under any test conditions.
The restriction level was medium, so installing multiple EX360’s in a loop will not have a major impact on flow rates.
Note: The EX360 sample tested was in very good used condition and has been modified by having two extra ports fitted to the tank. I do not think this modification affected its performance result in any way at all but it’s worth mentioning.
Features & Quality -3/5
The matte black finish on the EX360 is great and has stood up to some abuse in the workshop during modding and while fitted into a couple of running systems.
The core is ultra-thin at 16mm, the thinnest of the test group. I believe XSPC maximized the core’s performance potential by having deep internal shrouds on each side. The EX360 has just the 1 pair of ports so the end user has no options for fill/bleeder ports.
It has a dense core structure (18F FPI) so you can expect some regular maintenance to remove dust accumulation to keep the rad performing as well as possible.
Summary – 3.0/5
The EX360 from XSPC is an EOL rad, having been replaced by the AX series slim rads. At the time it’s largest assets were it’s slim design and it’s low price. However there are better performing and cheaper slim radiators out there.
Where to buy: $60 – PPCS


[…] Radiator Phobya G-Changer V2 Full Copper 360 Radiator Watercool HTSF2 3×120 LT 360 Radiator XSPC EX 360 Radiator XSPC RX v3 360 […]
Comments are closed.