


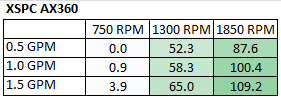
This first table shows the AX360’s W/10ΔT numbers in a quick glance chart format.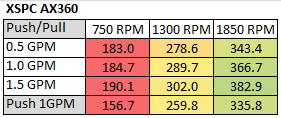 Using this data we can effectively show percentage gains/losses relative to a reference point. It’s an interesting way to show gains/losses while changing a variable.
So, let’s focus on 1300 RPM as our reference and see how much gain or loss in performance we get by changing fan speed up and down.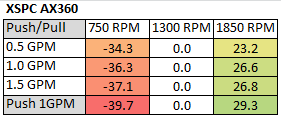
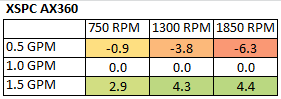
In our Tuning Table for Flow Rate Variance with 1.0 GPM as a reference point, we again see little variance between results when changing flow rates at the same fan speed.
The next three tables have specific reference points set for gain and loss comparison.
1.0 GPM @ 1300 RPM reference point: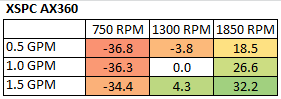
0.5 GPM @ 750 RPM reference point:
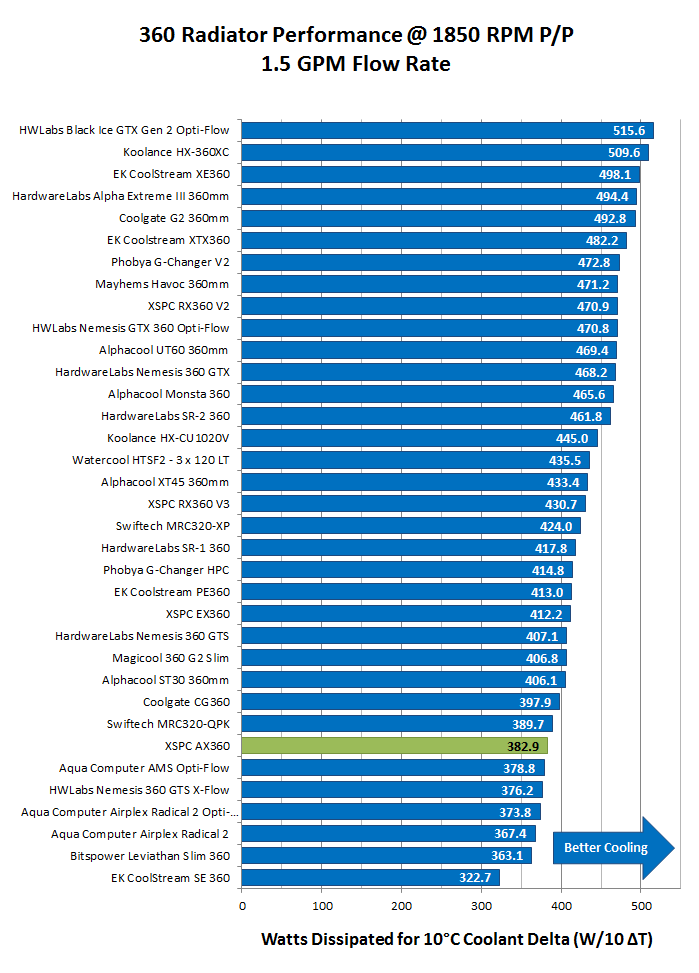
1.5 GPM @ 1850 RPM reference point: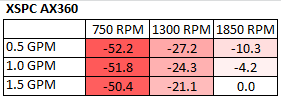
So from the data above we’re getting a good idea of how the AX360 radiator performs relative to itself. But there is a large selection of 360mm radiator models to choose from, so let’s put the AX360’s results into some comparison charts.
There is a LOT of data which make up our charts and previously we have not published all of it. After receiving requests for certain data to be included we’ve decided to now include even more plots. Aware that we are at data saturation point and are at risk of the page becoming information overkill – we’ll try and keep things somewhat simplified by applying spoilers on some plots from now on. All the data will still be available, it simply means a few extra click for those who wish to analyze everything.
Push Only Data vs Competition
Let’s focus on the Push Only results for now, we’ll get to the Push/Pull data later.
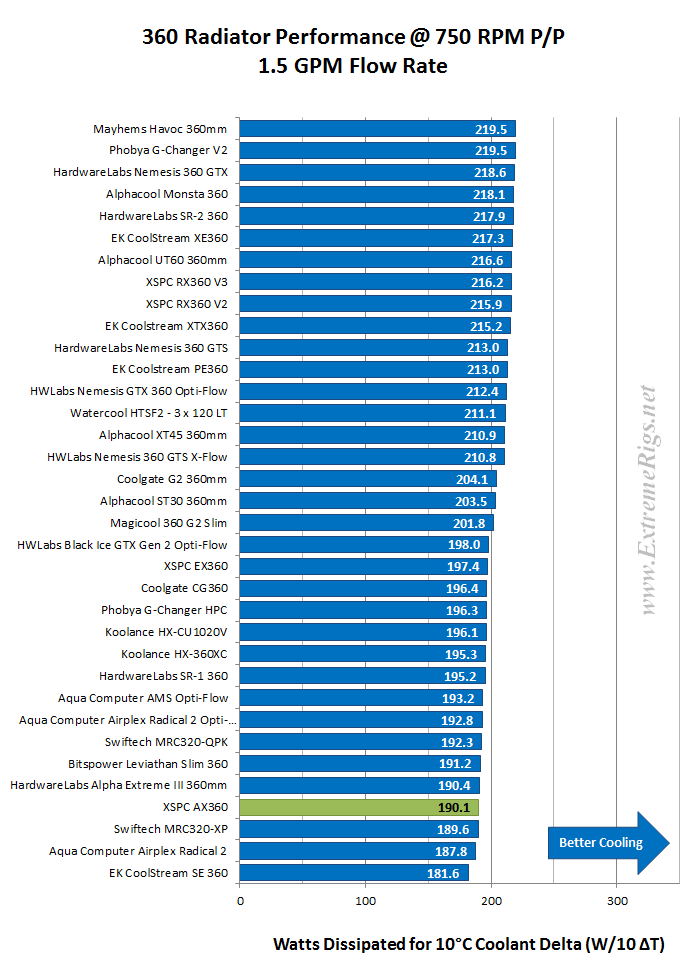
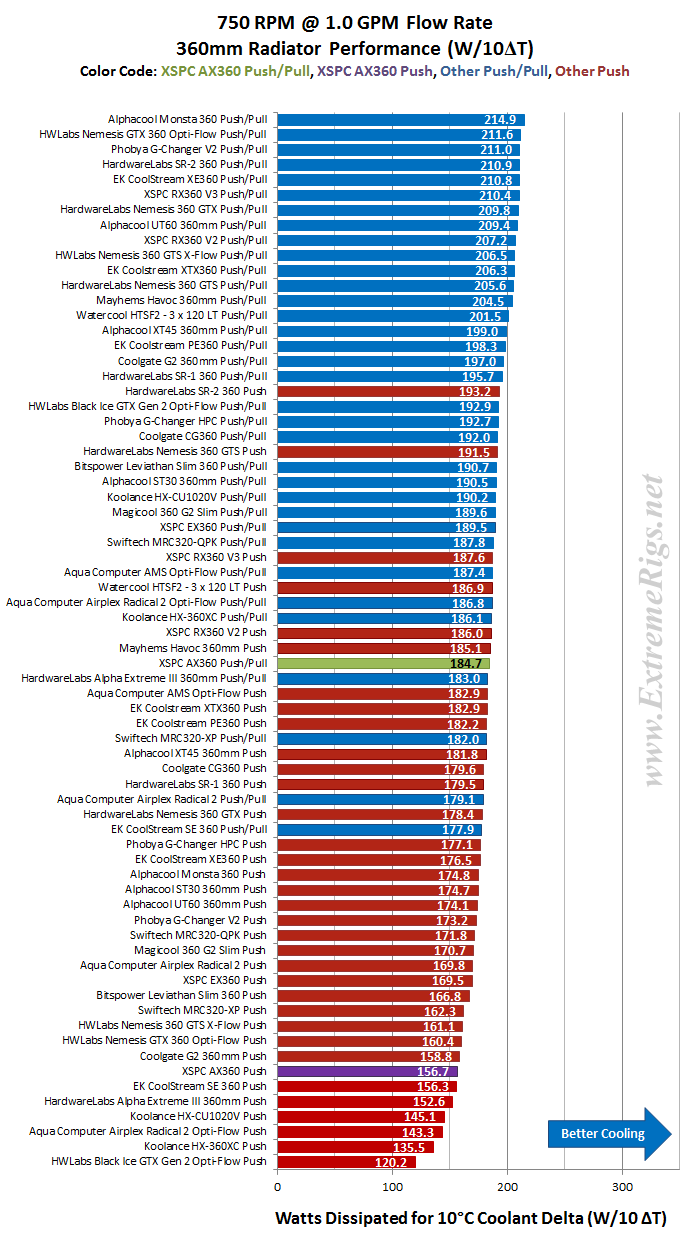
First – the 750 RPM data and let’s see how the AX360 compares.
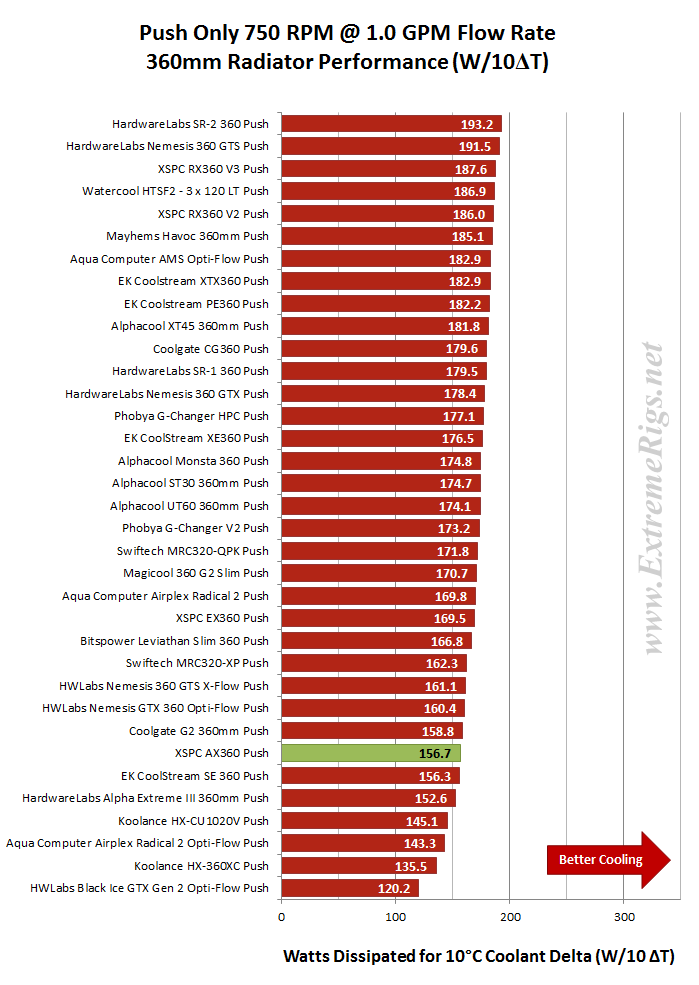 Clearly the AX360 is not up with the best performing of the radiators tested in Push Only at 750 RPM. Luckily the results are always close at this data point and the ~8% difference between it and the best performing is unlikely to bother too many potential AX360 buyers who have low fan speeds in mind.
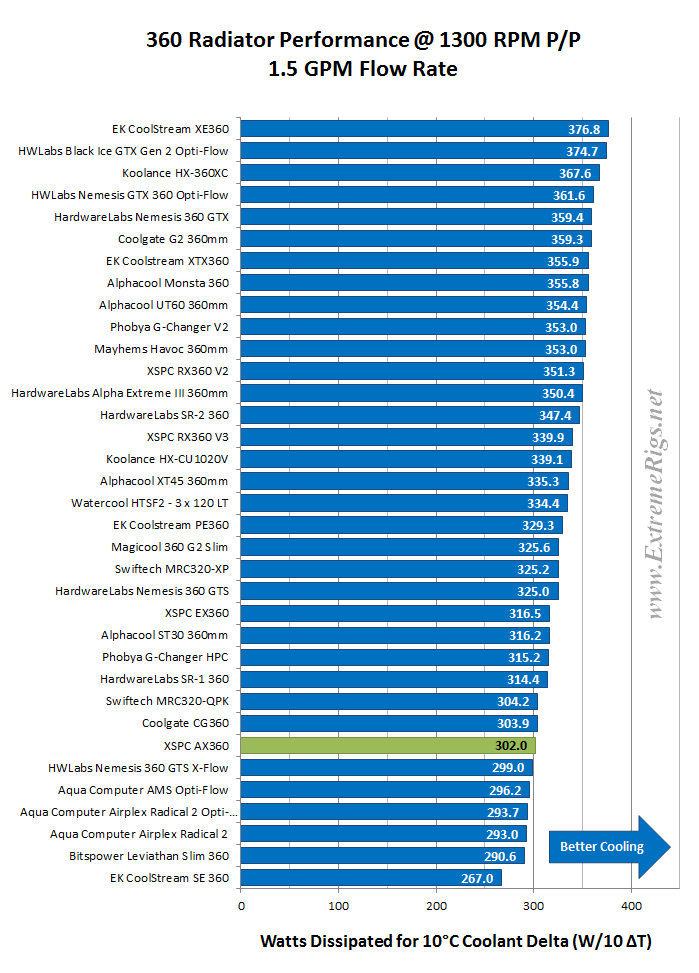
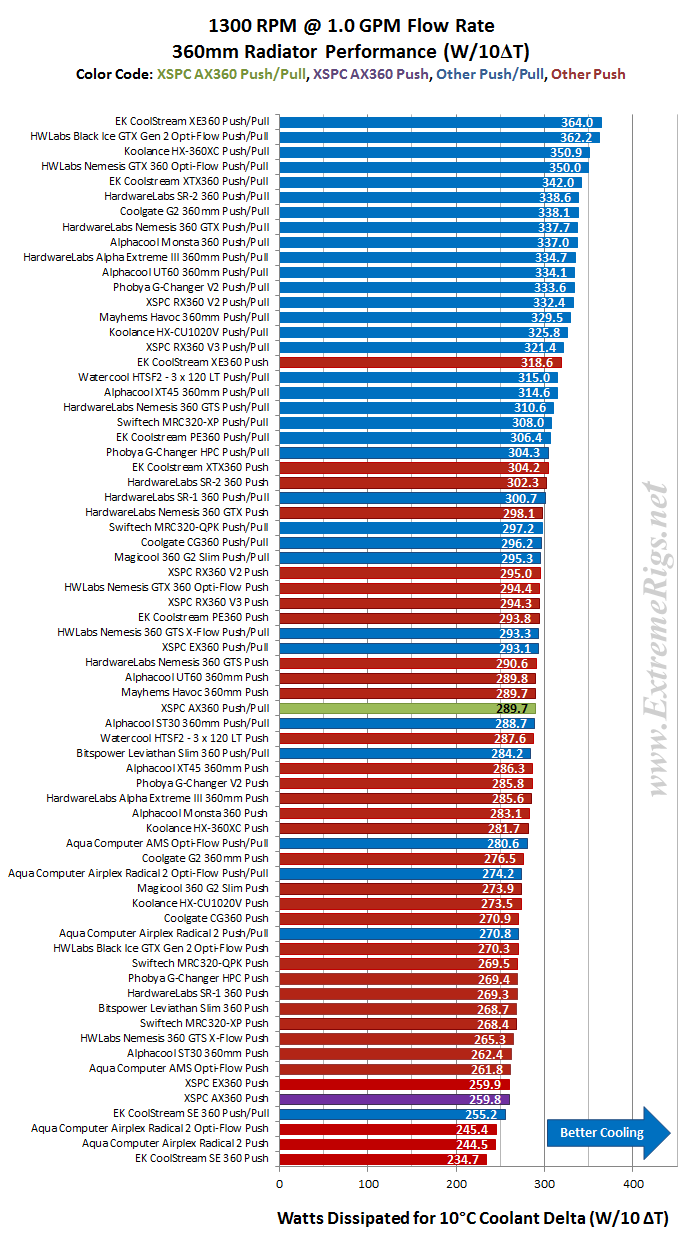
Now let’s look at 1300 rpm:
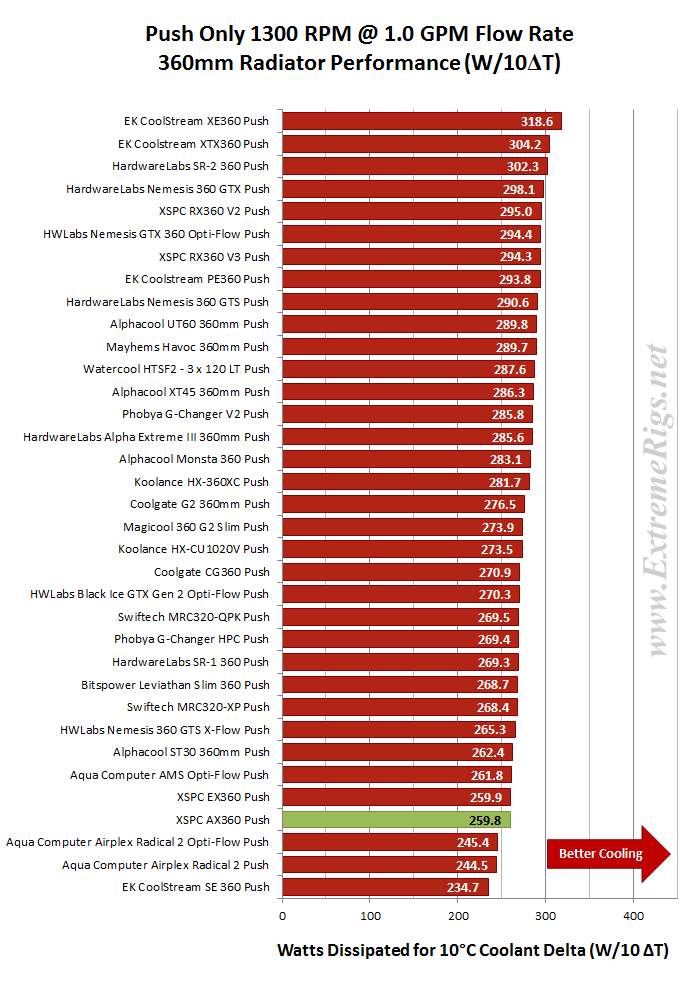 The AX360 dropped a few spots in the rankings for Push Only 1300 rpm and is now ~18% behind the top rad. We admit to hoping for a better result, after all this is the AX360’s sweet spot and we believe it to be the installation configuration that the majority of users will be running.
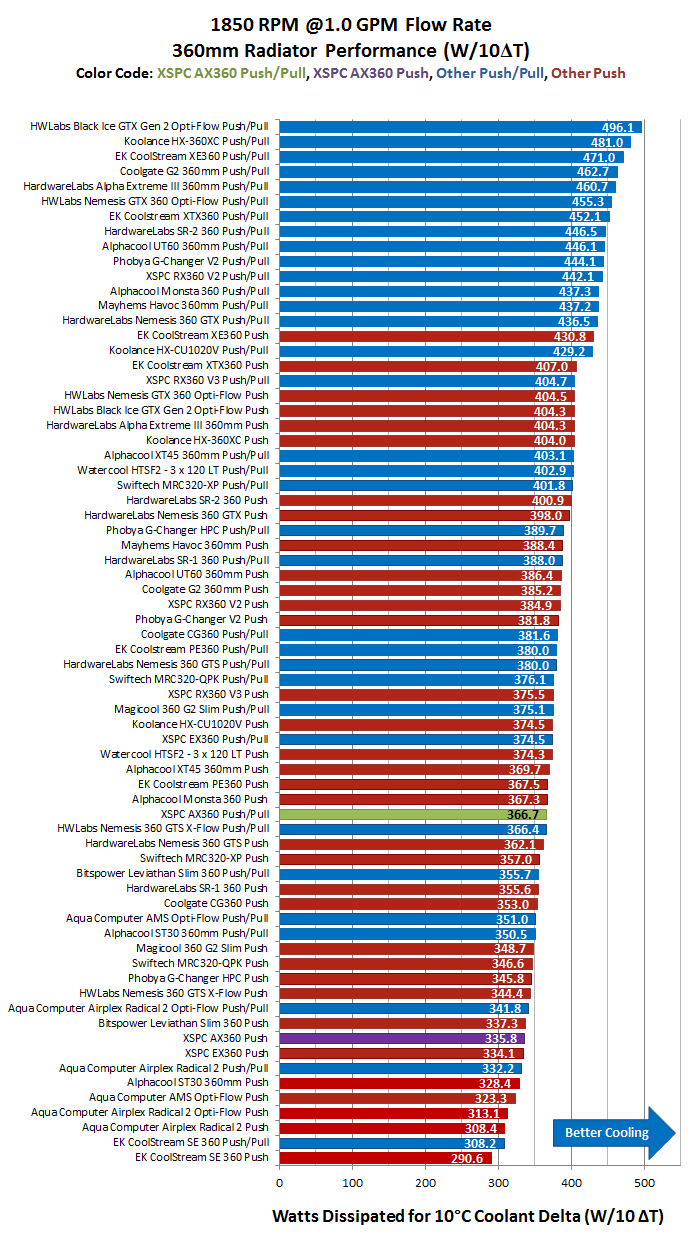
Now 1850 rpm Push Only:
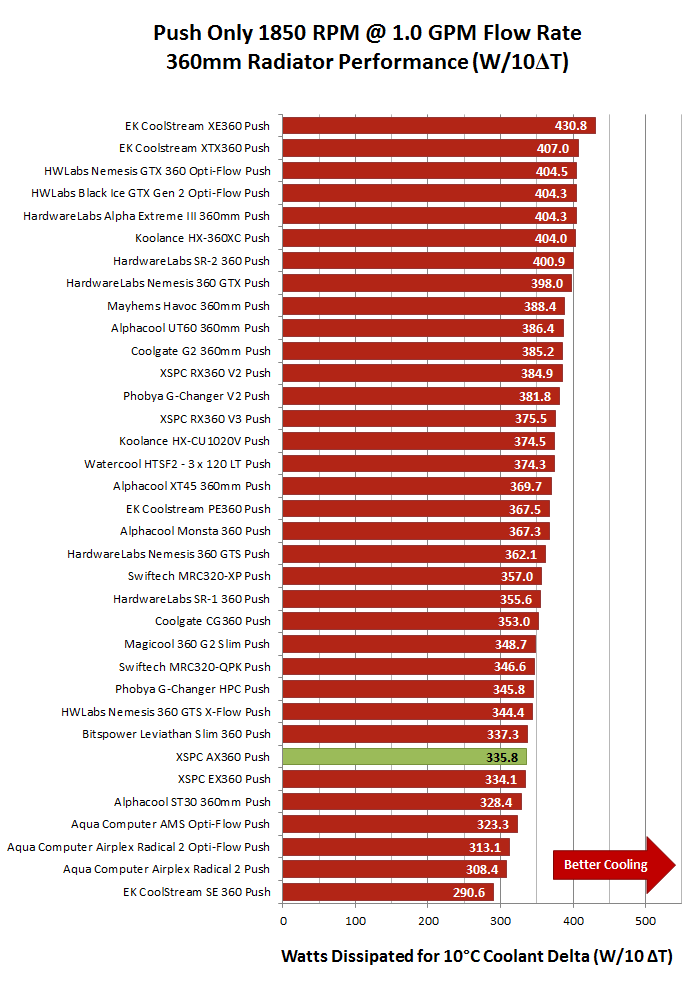 At 1850 rpm the AX360’s high fin count helps it to pick up a few ranking spots but is still rooted to the lower section of the ranking table.
Unfortunately the AX360 was not really competitive in the Push Only performance rankings. It should be noted however that in these comparisons we are comparing to radiators with significantly thicker cores.
Let’s find out how the AX360 performs with Push/Pull fans.
Push/Pull Data vs. Competition
For Push/Pull comparisons we display the plot and comment on the averaged results for each fan speed, while the individual flow rate results are spoilered.
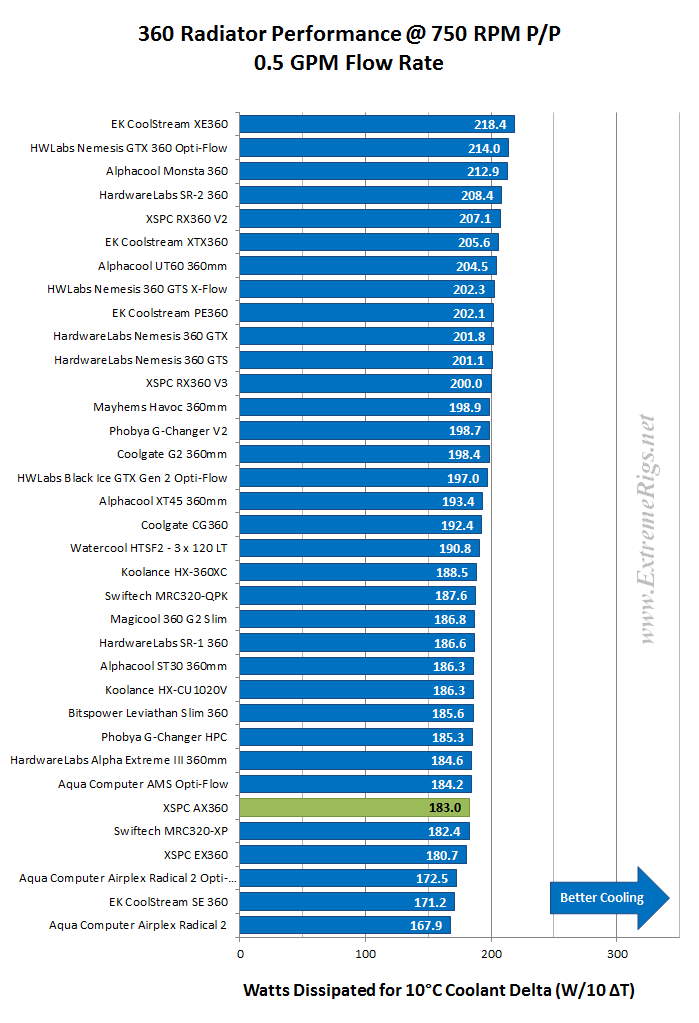
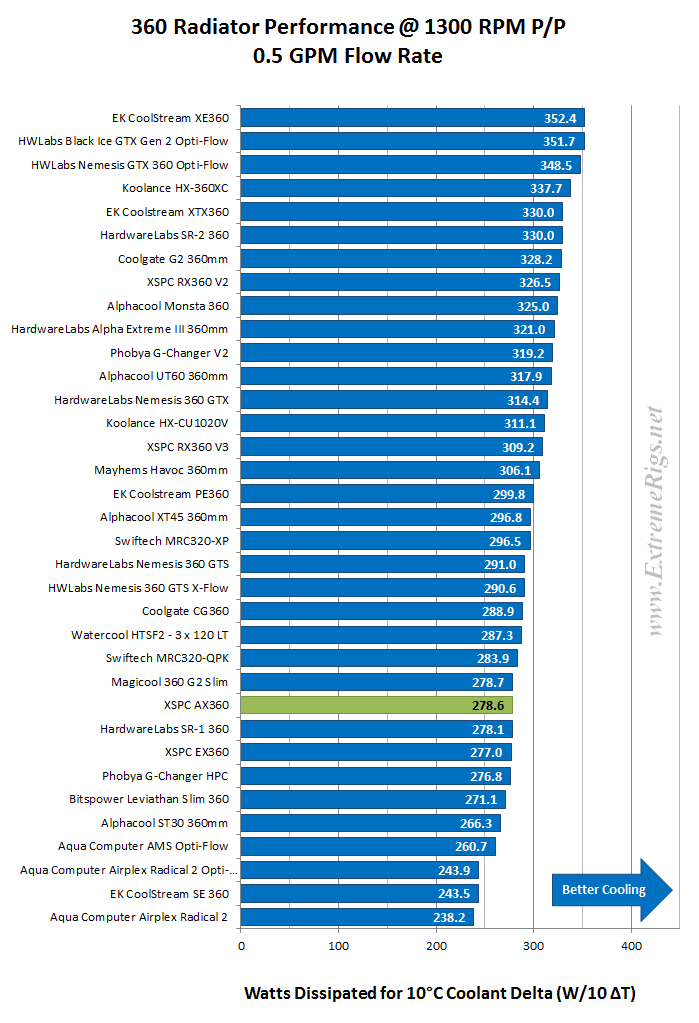
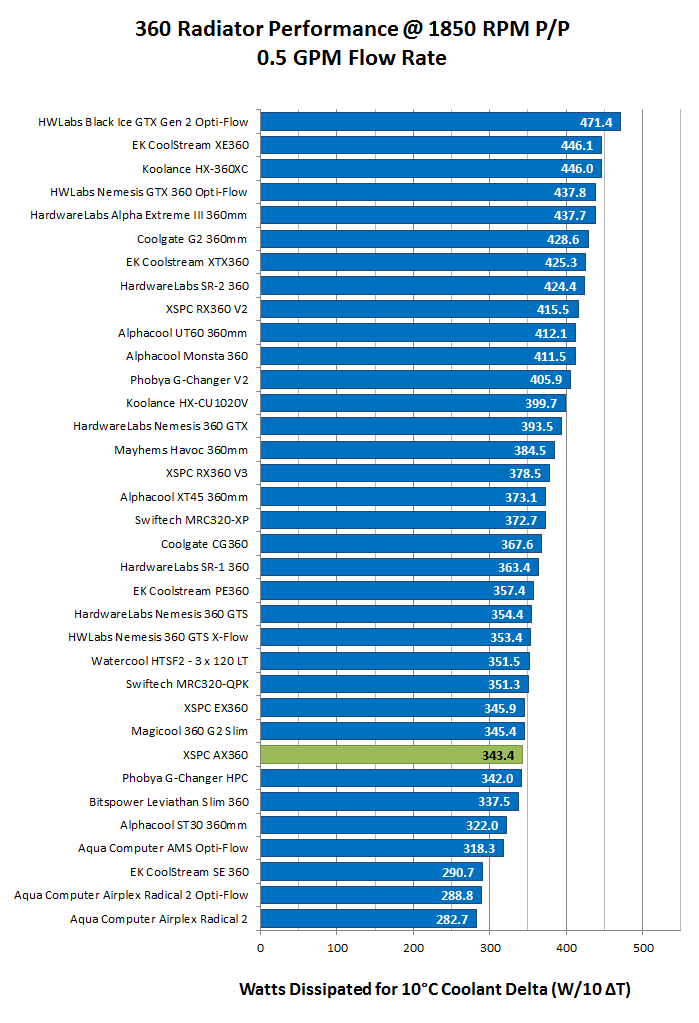
Firstly the 750 rpm:
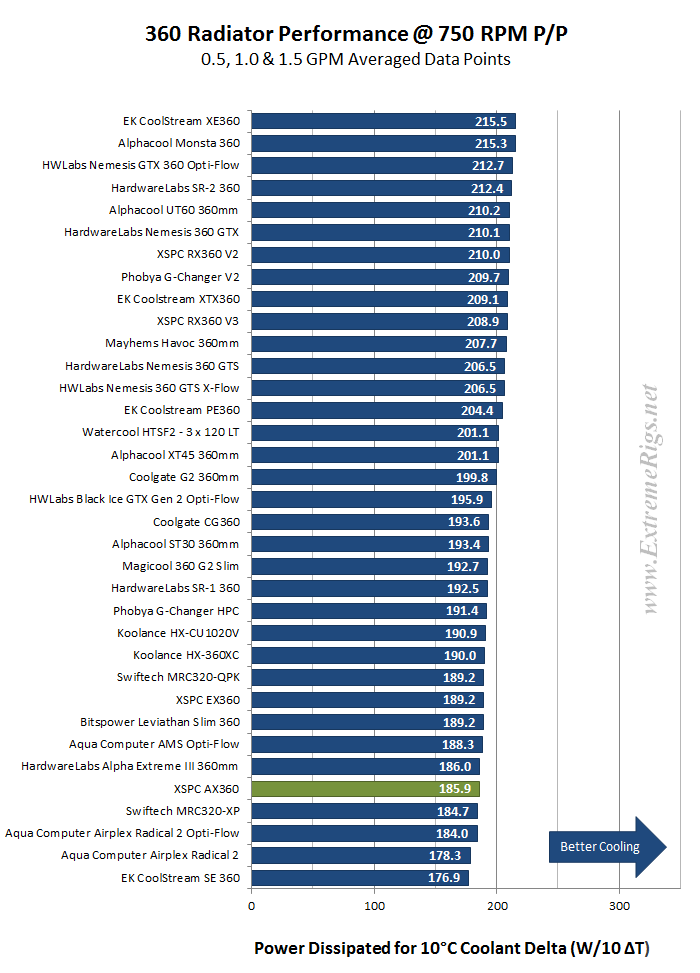 The AX360 lands in 5th to last position with a low speed Push/Pull fan assembly. The 20 FPI is apparently just a bit too dense for low speed fans to dissipate the heat as well as the other radiators in the test group. As to be expected, it does offer better performance as the flow rate is increased, but so do the other radiators.
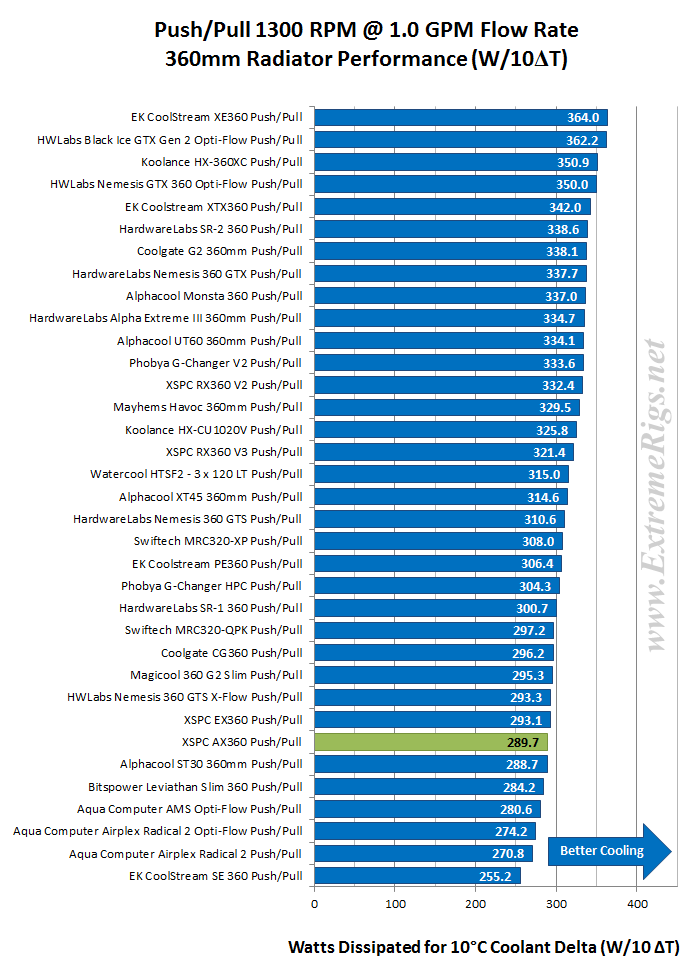
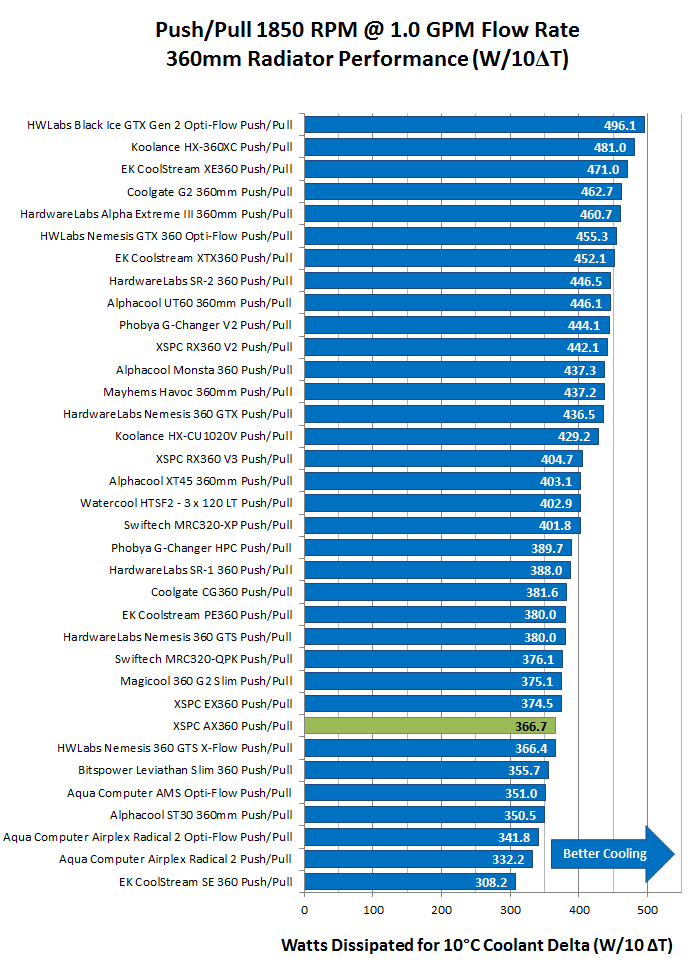
Let’s move to 1300 rpm:
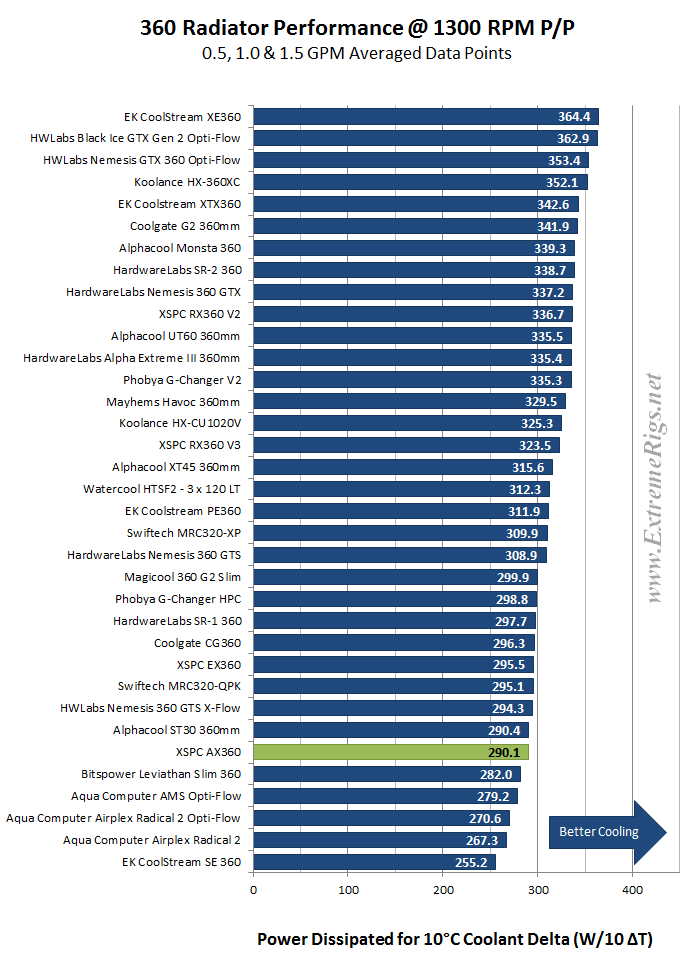 At 1300 rpm Push/Pull the AX360’s ranking is similar to what we saw at 750 rpm. It seems there isn’t much grunt under the hood and performance wise, the AX360 is shaping up as somewhat of a disappointment.
Now 1850 rpm:
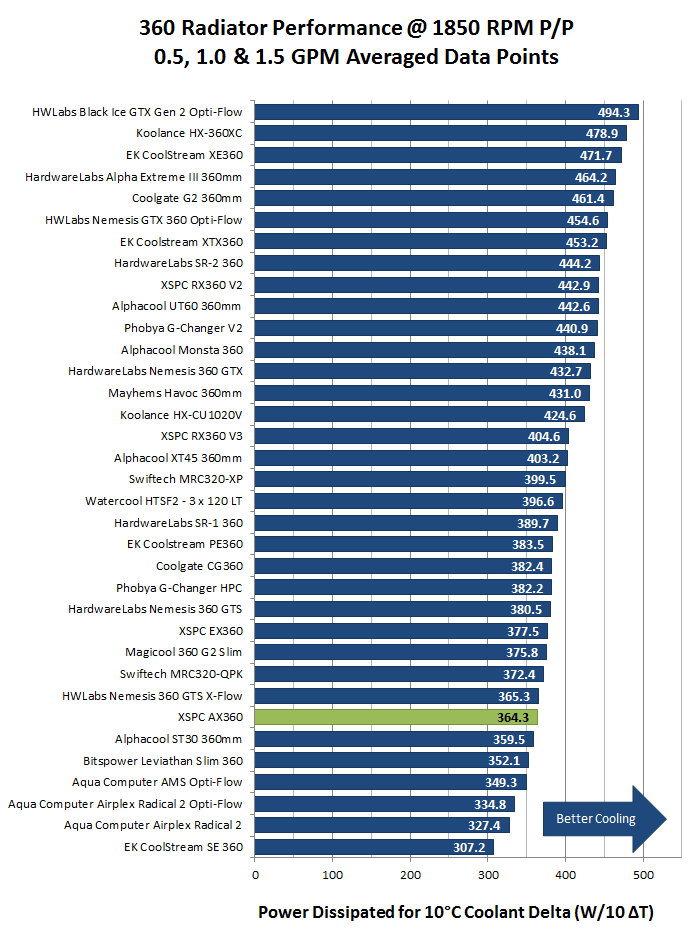 1850 rpm Push/Pull is possibly the most unlikely installation scenario for the AX360 and one which we can’t recommend using it in. The AX360 again places toward the bottom of the rankings, and is a whopping ~24% behind the best performing 360mm radiator which is available to purchase. In the AX360’s defense it is 27% thinner than the HX-360XC which is 55m thick Vs. 40mm for the AX360.
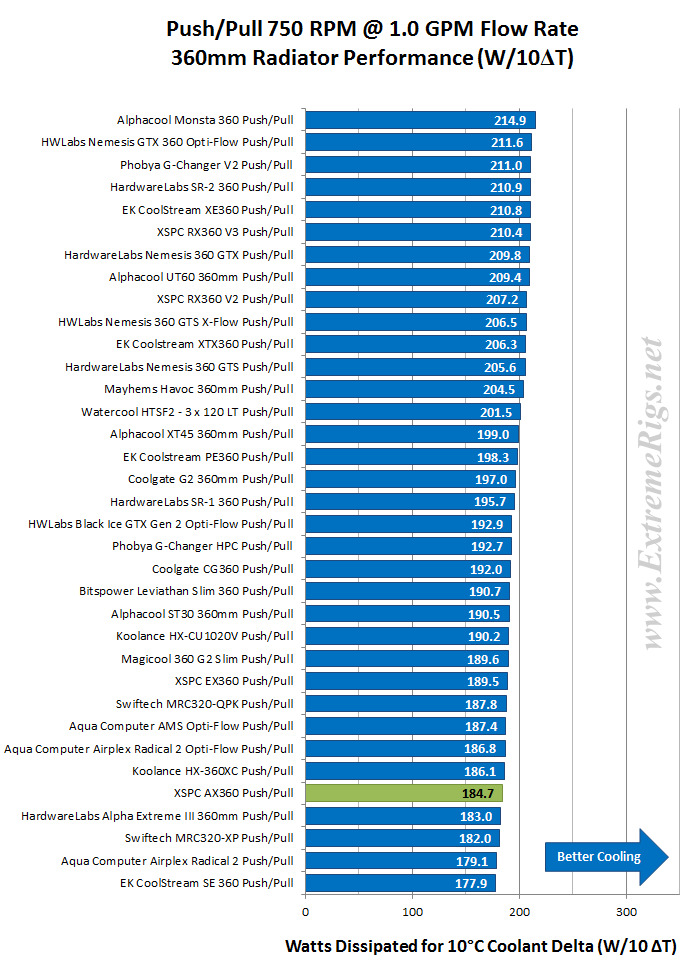
Let’s now combine the Push Only and Push/Pull results for each fan speed at 1.0 GPM so we see both sets of results on the same plot. Sometimes these combined plots show up some points of interest, however they are long, so again a spoiler has been used.
From all the test results we created “Average Performance Factor” charts for both Push and Push/Pull. We then made a combined plot of the average called the “Master Performance Factor”. The radiator with the best cooling ability (W/10ΔT) at each rpm was awarded a score of 100. Each other radiators W/10ΔT result was scored as percentage of the top performer.
This way of looking at the comparison takes away any advantages that a radiator may have at higher or lower fan speeds and looks at an overall average. While this appears fair it does tend to favor those radiators that are all-rounders and those radiators which do very well at high RPM. Most users should be more focused on their specific use case.
Here are the AX360’s percentage scores at each data point:
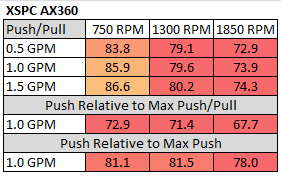 This table shows us that the AX360 is on average ~20% behind the best performing radiator at each data point that was tested. Lots of red box’s unfortunately mean it’s results were significantly lower than the best radiator at each data point.
As these percentage scores are relative to the best performer at each data point, we again advise readers to cross reference specifications and results for each radiator and keep in mind your intended fan assembly and operating speed.
The percentage numbers in the table above offer another way of looking at the AX360’s results. But for our scoring system we need a way to reduce the categories while retaining the data. To do this we average the results for each fan assembly type giving us Averaged Performance Factors. We calculate this for Push Only, Push/Pull and finally an average of everything.
Firstly – the Push Only APF:
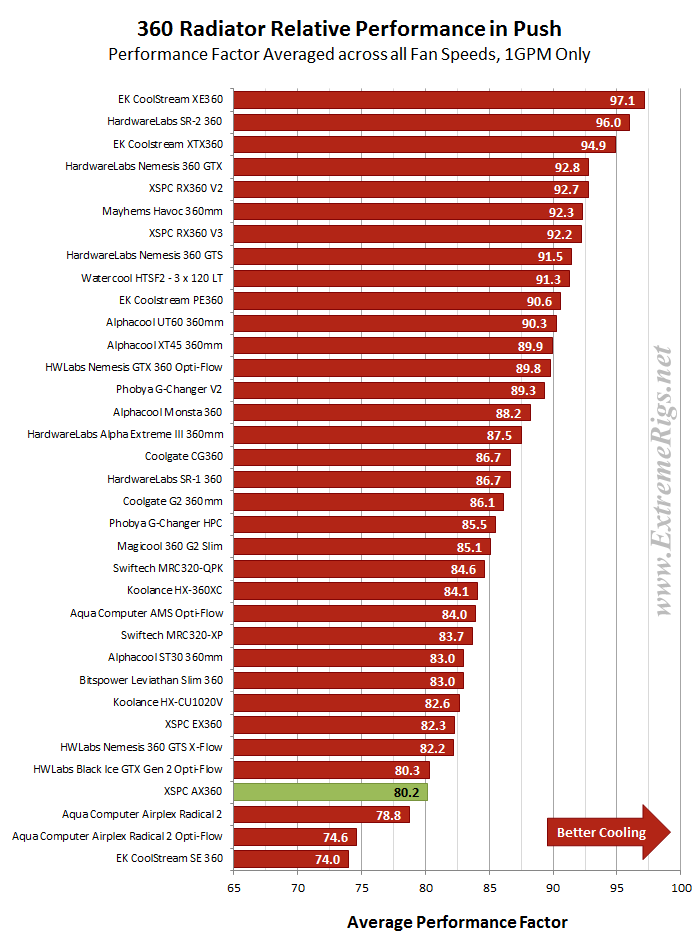 With an 80.2 % Averaged Push Only result the AX360 is the 3rd weakest performing radiator of the test group.
For a long time many including ourselves have considered the AX360 and EK’s PE360 to be similar enough in specs to have comparable performance. Our data appears to have put that belief to bed and the slight variations in core thickness, fin array, shroud height and number of tubes in fact result in significant changes to the potential performance. The AX360 has fared the worse of the two with our new data.
Now the Push/Pull APF:
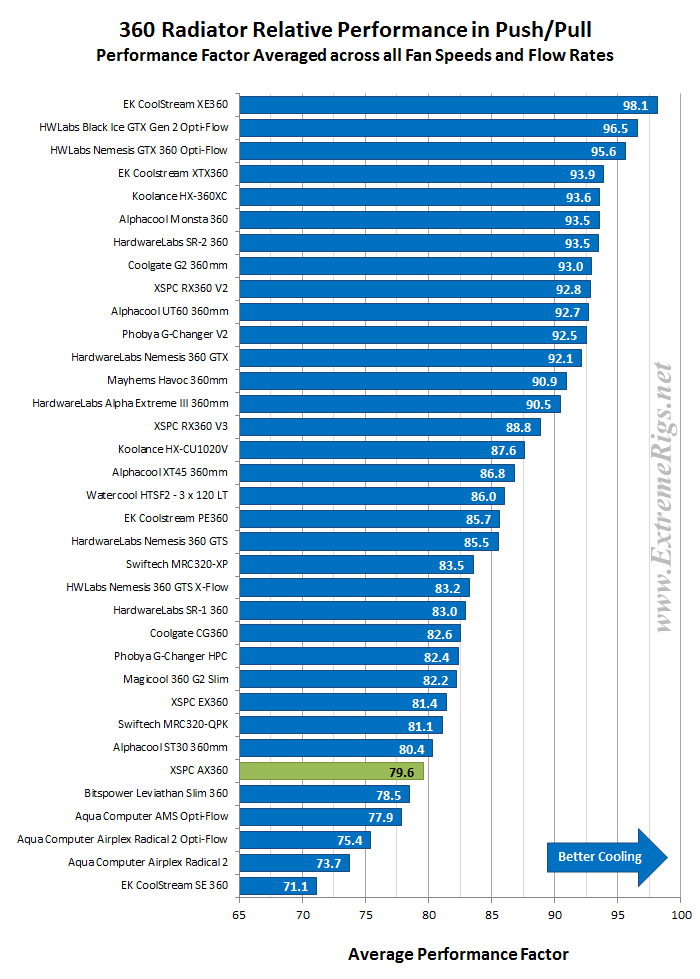 In the Push/Pull APF the AX360 is again towards the bottom of the rankings with a 79.6 Push/Pull APF.
Finally for thermal performance we created the Master Performance Factor which is calculated from the averaged results of all the Push Only and Push/Pull thermal tests, at all fan speeds and flow rates.
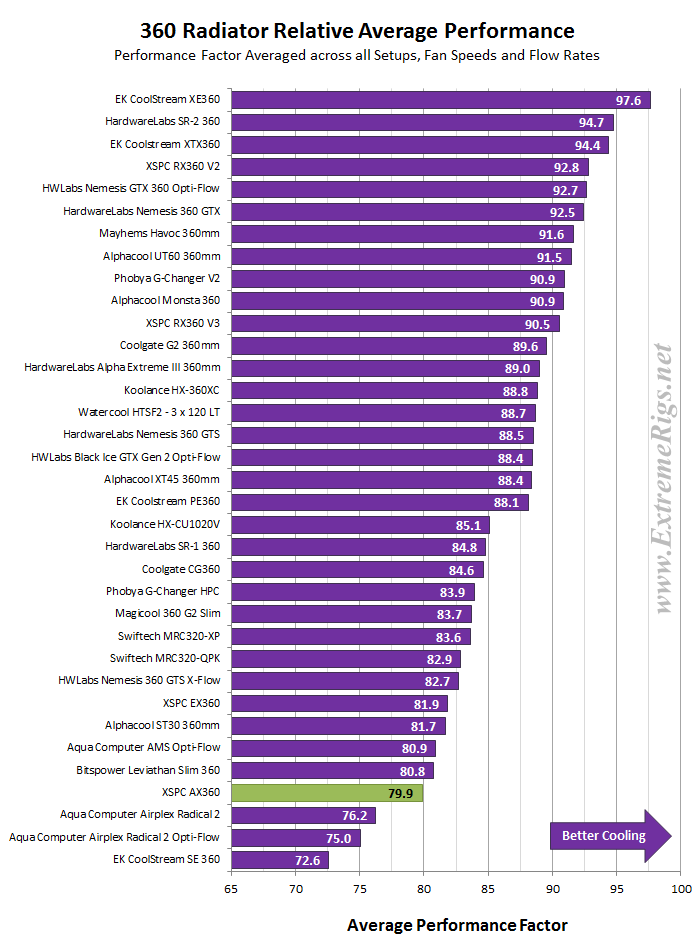 The MPF result of 79.9 and low ranking should come as no surprise by now as we have seen it placed similarly in all the individual test results.
Maybe it’s time for a revision of the AX360 to address the lack of performance compared to other models. After all it was released at least 3 1/2 years ago during which time other manufacturers have released new and often improved radiators, leaving the AX360 lagging behind.
Space Efficiency
The AX360’s space efficiency vs. performance might be a breath of fresh air as thinner rads almost always produce better results here than their thicker counterparts. However as the AX360 is built around a thin 20mm core but measures in at ~40mm thick overall, it could just as easily turn nasty.
We have used the Average Performance Factor results from the charts above to compile two plots which shows us how it compares to the other rads in terms of performance Vs. space taken.
First is radiator thickness Vs. APF
Here the combined APF scores were divided by the only radiator thickness, with the highest (most space efficient) issued a score of 100. Each of the other radiators results was converted to a percentage of the most space efficient radiator’s score.
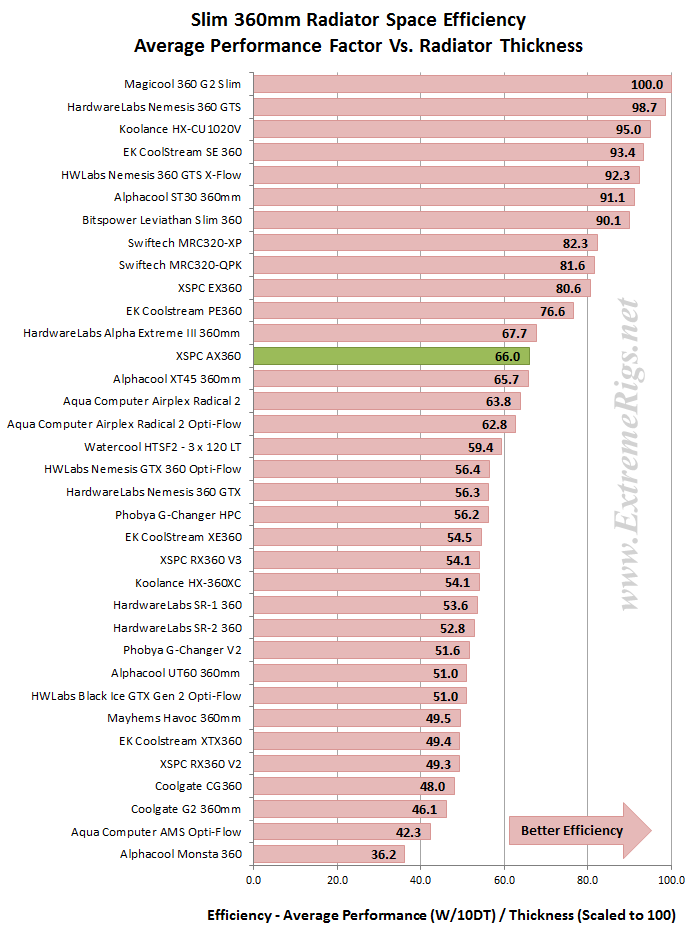
The results ended almost in order of thinnest to thickest and the AX360 can breath easy. While not super efficient, basically only slim rads were ahead of it and the order is almost in order of thickness.
Next we took the APF results for Push/Pull and divided it by the total thickness including the fans and applied the same scoring system. For the Push Only we used the Push Only Vs Push/Pull comparative results and applied the same scoring system when compared against the Push/Pull.
The rankings are ordered for Push Only as that is the most efficient fan assembly and each radiator’s Push/Pull result are placed un-ordered, just below it’s ranked Push Only score.
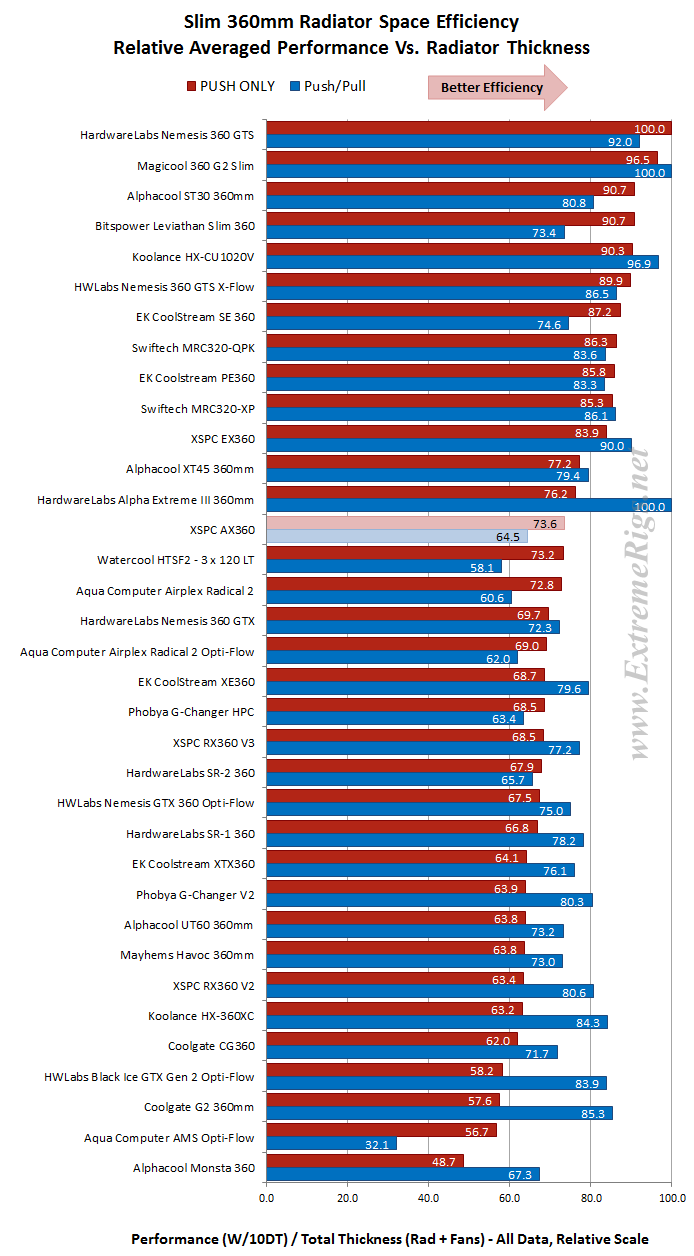 This plot is likely the most useful for readers of the 2 plots for space efficiency even though it is harder to decipher, especially the Push/Pull rankings. With fan thickness factored in the AX360 finishes middle of the pack for Push Only but the 64.5 Push/Pull result is 5th to last.
Value Factor
While our APF’s are still fresh in mind, let’s now look at some performance results vs radiator price to show which of the 360mm radiators might offer the best bang for your buck. Each radiator’s combined APF scores were divided by the radiator cost and again we applied our scoring system of percentage Vs. the best performer of the category.
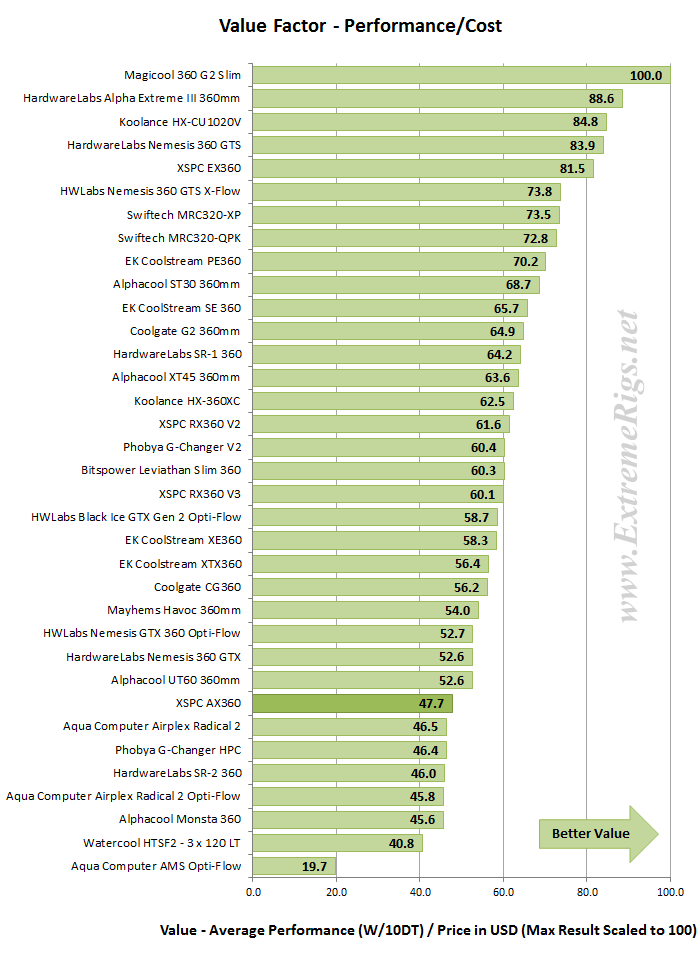 The AX360’s Value Factor turns out to be quite low. It’s poor performance was the main contributor to this metric, however there was only 9 other radiators in the test group more expensive than the AX360 which currently has a retail price of $100 USD. No doubt the aluminium enclosure is a contributing factor to the AX360’s higher price point especially when compared to other radiators with thin cores.
Next Up – Summary!


