


")
The Thermal Data
Moving on from the restriction test bench the Aqua Computer AMS was loaded into the thermal test chamber for a series of tests – consisting of 3 flow rates, each having 3 different fan rpm rates tested. I felt the thermal test data was most important and which you as the reader would be most interested in.
Below is the final data results gathered from at least 2 data logging runs at each flow rate and fan rpm combination. The most stable 15 minute period from each logging run was used and then averaged with the other runs to obtain the data for the table below. A total of 16 temperature sensors were used in the thermal test chamber (8 air in, 2 air out, 3 water in, 3 water out) each take a reading every second and logged via a CrystalFontz unit. The data in the table below is the result of the logging runs which has then been used to create all the plots and tables there-after.
The performance metric of critical importance is the delta between the warm coolant temperature in and the cold ambient air temperature in to the radiator. Given that the system is well insulated and in equilibrium and we know the heat input to the system then we can also calculate a very important number – that is the amount of power required to raise the coolant temperature 1C (or 10C which is more useful reference point).
First tested was the Reverse Flow. As previously mentioned, reverse flow on NON U-Flow rads proved to be worse performing, so I decided to only test Reverse Flow with Push Only fans, and allow more time for the better performing OptiFlow.
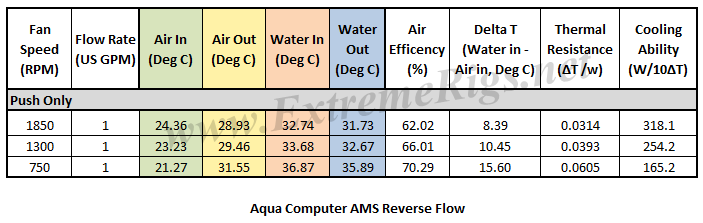
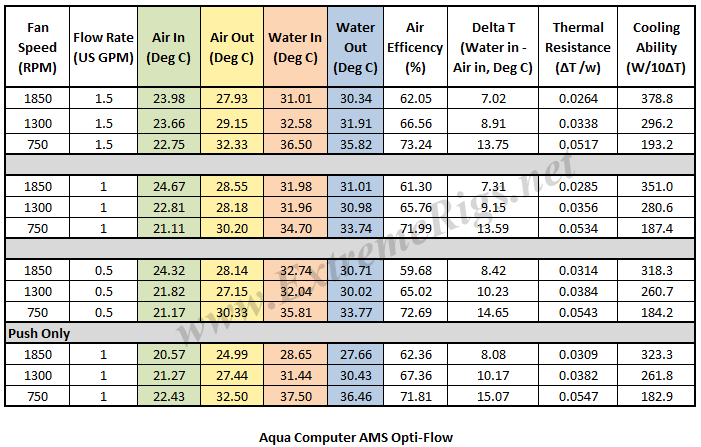
At a later date the AMS was reloaded into the thermal chamber with a slightly reconfigured tubing arrangement to accommodate the OptiFlow testing. Comparing the Reverse flow results above to the Push Only results below, it is clear that OptiFlow again performs better. So from here on only the OptiFlow data for the AMS will be posted.
Let’s take a look at the Delta T results from the tests, in bar chart form first:
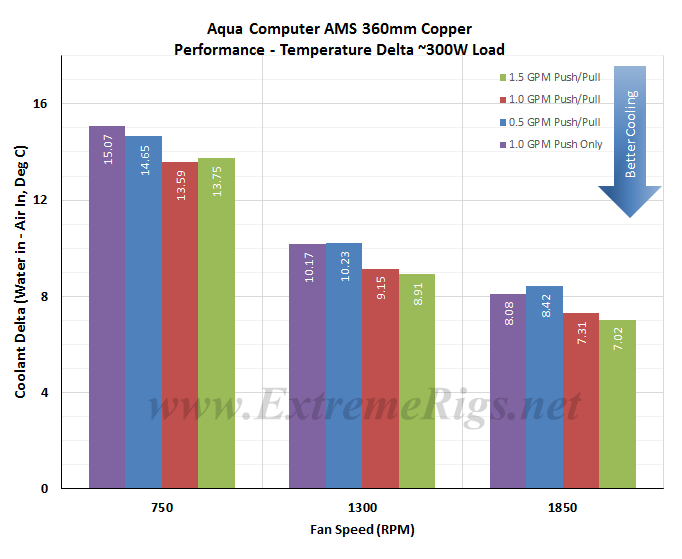
While the numbers seem a bit strange at first glance you have to remember that the pump power also changes for each flow rate which changes the total power dissipated by the radiator. Things will be clearer once we factor in the total power dissipation.
The plot clearly shows the 1.0 gpm Push only yielding a lower delta temp than the 0.5 gpm Push/Pull at higher fan speeds which indicates that the lower flow rate may be affecting the thermal performance of the AMS when airflow is no longer the dominating factor. To really analyze this data though we have to look at how much power was being dissipated in each case to really compare in an “apples to apples” fashion.
Delta T results (as above) are not always helpful when thinking about how many radiators you would need to cool your system. Instead it’s more useful to know the delta/W, or more usefully, the inverse metric of W/delta C. The metric plotted below tells us how many watts are dissipated by the radiator when the coolant rises 10C above ambient temperatures. (10 Delta T):
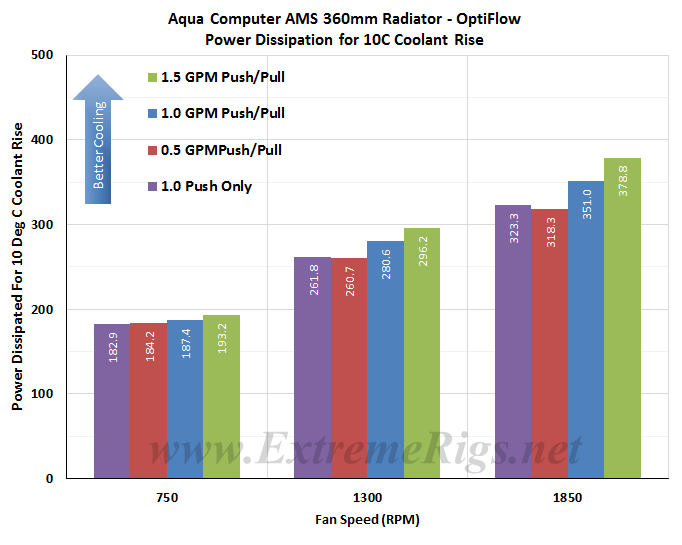
This seems a good a spot as any to mention that the OptiFlow testing on all the rads that could benefit from it produced some results that were not as expected. The AMS was no exception (as seen above) and despite numerous retesting the results left us bewildered at times at the data which was produced. The main cause for bewilderment was the calculated power dissipation result (Coolant Delta x Flow Rate x Heat Capacity) which is then used to calculate the overall performance metric (W/10DT). Some of the discrepancies we can attribute to error margins – that being uncontrollable fluctuations of the test rig such as power fluctuating which can effect fan speeds, flow rate and heater power. However despite many retests and even having a 1000 watt power conditioner between the wall and the PSU there is still something funky with the optiflow push data. I wish I had a proper explanation for some of these results, but at this stage unfortunately I do not. So I am going to present the data and try to ignore the abnormalities that may exist.
As expected increasing airflow through the radiator is the primary determinant in changing the radiators performance. However, we can clearly see that the low flow rate of 0.5 gpm has a negative effect on cooling performance. So much so that a Push only fan set up at 1.0 GPM outperforms a Push/Pull set up at 0.5 gpm with medium and high speed fans.
This data can now be plotted as a pretty curve so that an end user can interpolate their own fan speed. Note again that the extrapolation of the curve is much more sensitive to error than in between the tested range. Let’s exclude the push data for now and come back to it:
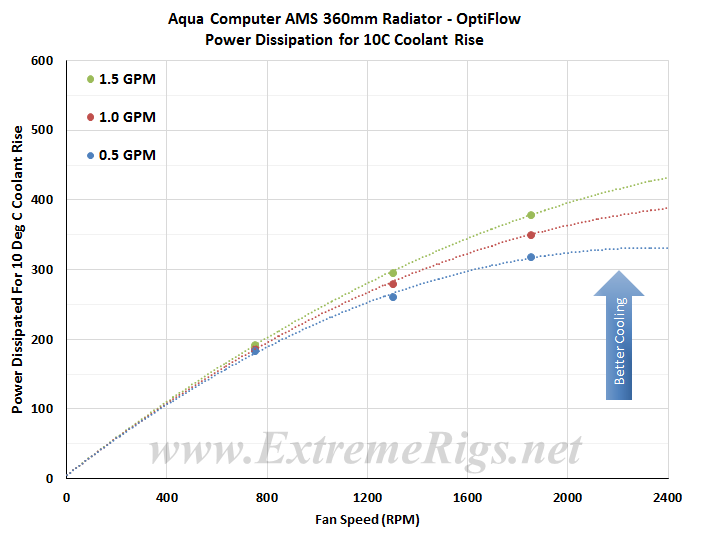
These plots make it easier to see that at higher fan speeds that a low flow starts to impact the cooling performance. This makes sense if you take it to the extreme and think about a very low flow rate where the coolant is already cooled 99% of the way to ambient with 10% of its journey through the radiator. In this example the radiator is not being efficiently used. 90% of the radiator surface area would then be wasted and you could have used a smaller radiator. Both coolant flow and air flow can limit thermal performance, however in typical systems coolant flow is a much weaker effect than airflow due to typical choices of fans and pumps.
If we now come back to the push data it’s good to compare only the push to push/pull data in an “apples to apples” fashion by only looking at the 1GPM data:
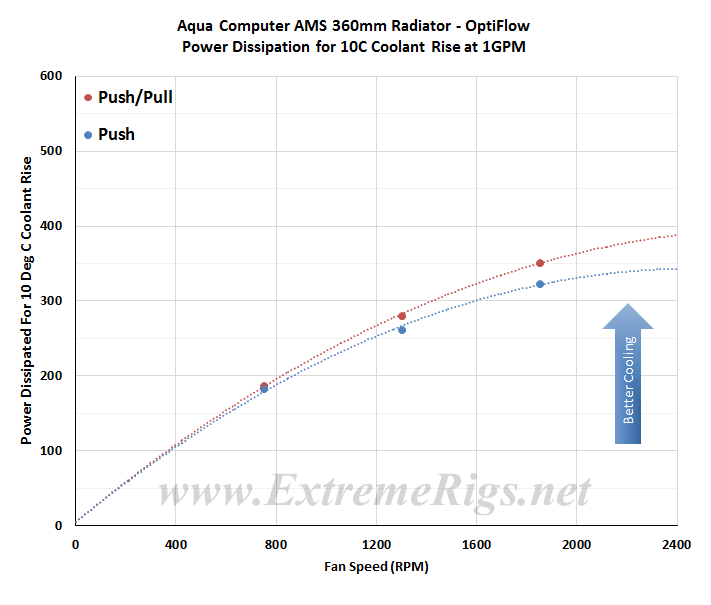
Push Only gives around 94% (averaged) of the performance of the Push/Pull 1.0 gpm test results on this radiator.
Having said all of this about flow effects they are in reality small. So in this next plot all three flow rate results were averaged together to produce one curve. Averaging reduces test error of course so this helps further to be sure of our data and is more useful therefore for comparing to other radiators.
Here one of the top performing and worst performing radiators from group 1 of the round up have been plotted along with the OptiFlow results to see how the AMS compares against them.
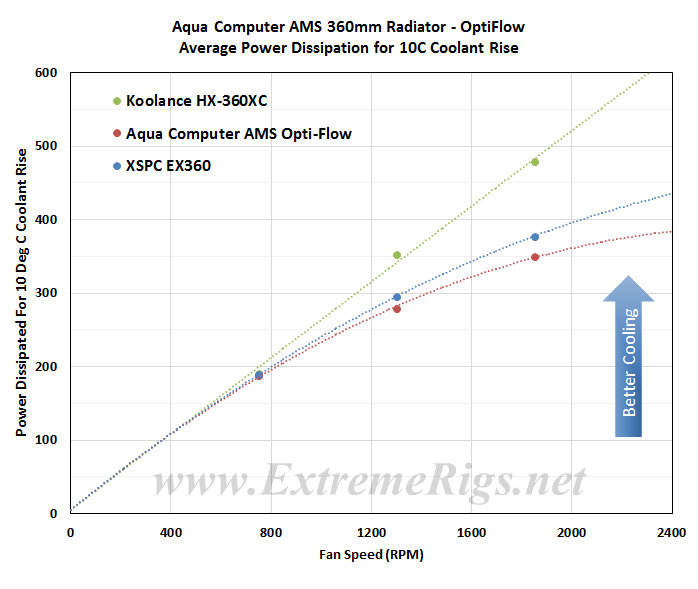
As you can see the AMS performs worse than the the worst performing radiator from the Group 1 testing when the fan speeds start to increase. This is not good, not good at all!
Now let’s analyze that data some more….


[…] Aqua Computer AMS Copper 360mm Radiator Review […]
[…] UT60 360 Radiator Alphacool XT45 360 Radiator AquaComputer Airplex Radical Copper 360 Radiator AquaComputer AMS 360 Radiator Coolgate CG 360 Radiator Coolgate G2 360 Radiator EK SE 360 Radiator EK PE 360 Radiator EK XTX 360 […]
[…] […]
Comments are closed.