


")
The Data
As all the testing in this round up was performed with the exact same equipment, using the exact same methods I have decided to keep each radiators page uncluttered by posting our testing methodology, test set-ups and equipment used in a single location. To see exactly how the tests were carried out, details of the test set ups and equipment used, please head back to the RRU Test Setup page.
Restriction Test
It’s generally agreed that radiators are one of, if not the least restrictive components in the water cooling loop. There are some exceptions however, so this must still be verified through testing:

The above photo is for referencing the restriction test bench. The AMS is not loaded so please disregard the data in the picture as it does not relate to the AMS test results.
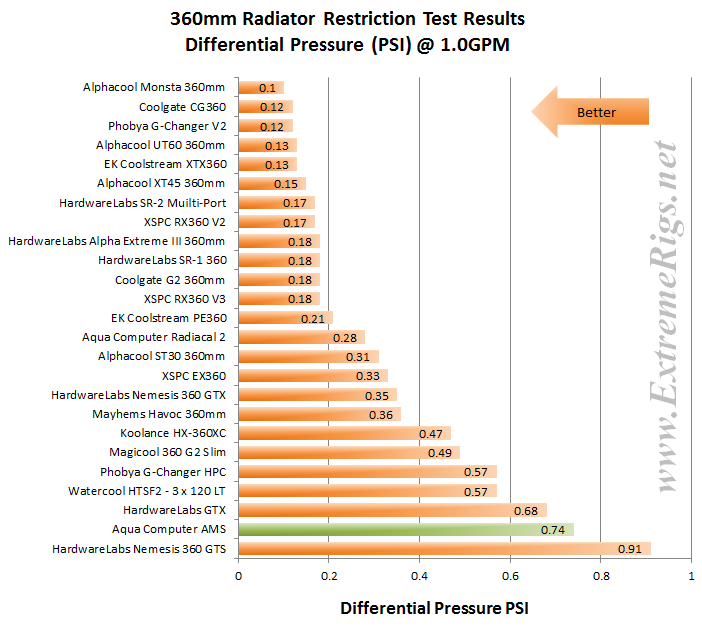
Here is the raw data at the tested flow rates, displaying the measured Differential Pressure across the radiator as flow rate was increased.

The table numbers indicate that the AMS is a high restriction radiator. However numbers in isolation can only tell half the story. By plotting against other components it more easily shows the whole story. I have decided to use a HeatKiller 3.0 CPU block as the reference in these plots for two reasons. Firstly there is no chance of the plot being cluttered by curves overlapping and secondly it gives a reference point against a fairly common loop component of average restriction. As with all the radiator restriction plots I have limited the maximum flow rate displayed to 2.0 GPM as I suspect there are very few systems that operate above 2.0 GPM. For more information on how to read a restriction plot check out our guide.

This plot confirms the AMS as a high restriction radiator. Generally we do not see a radiator’s restriction data plotting anywhere near the reference CPU results.
The next three plots show the AMS’s restriction level relative to other radiators in the test group. Normally I show just the 1.0 gpm plot, but on the AMS it was interesting that as flow rate increased so did the restriction level relative the other radiator results. This increase was enough to make it the most restrictive of the test group at a high flow rate.


Onwards to Thermal Performance!


[…] Aqua Computer AMS Copper 360mm Radiator Review […]
[…] UT60 360 Radiator Alphacool XT45 360 Radiator AquaComputer Airplex Radical Copper 360 Radiator AquaComputer AMS 360 Radiator Coolgate CG 360 Radiator Coolgate G2 360 Radiator EK SE 360 Radiator EK PE 360 Radiator EK XTX 360 […]
[…] […]
Comments are closed.