


The Thermal Data
Moving on from the restriction bench the Eisbrecher Pro XT45 was loaded into the thermal chamber for a series of 6 tests conducted at 1.0 GPM with Push/Pull fans and Push Only, each having 3 different fan rpm speeds tested.
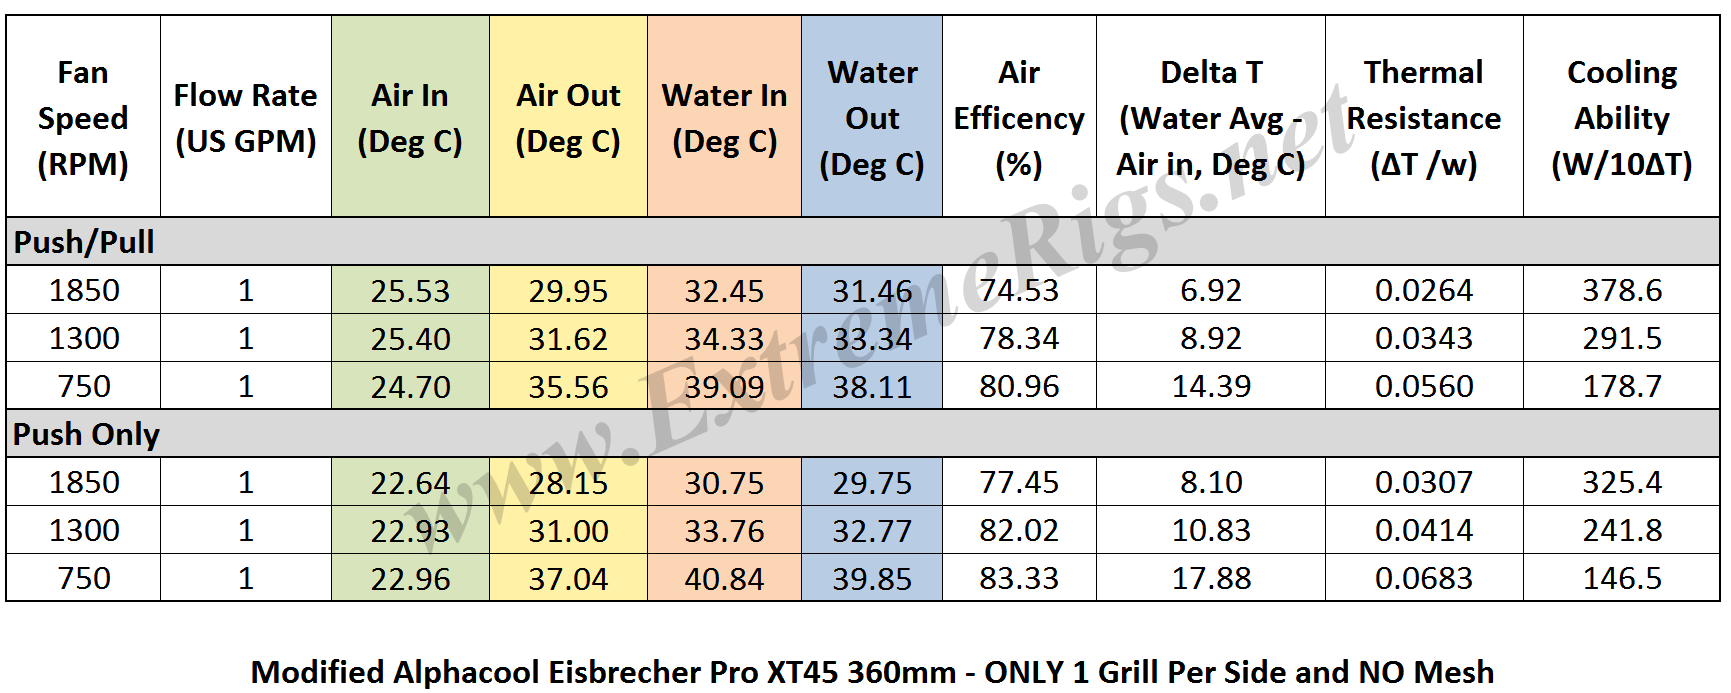
Below is the final data results gathered from at least 5 data logging runs at each fan rpm. The most stable 15 minute period from each logging run was used and then averaged with the other runs to obtain the data for the table below. A total of 16 temperature sensors were used in the thermal test chamber (8 air in, 2 air out, 3 water in, 3 water out). Each sensor takes a reading every second and logged via a CrystalFontz unit. The data in the table below is the averaged results of the logging runs which has then been used to create all the plots and tables there-after.
NOTE: Since our massive Radiator Round Up was completed, the thermal testing rig was retired and parts pulled from it for use in other projects. However, the rig was recommissioned for this review and one other, but after several days testing we were unable to get the same calibration on the rig as in the past. Therefore we are not able to compare (apples to apples) these recent results with data previously recorded. Because of this we re-tested a couple of radiators with the new calibration so that we do have some results to compare the Eisbrecher Pro against. As we were changing the testing comparison we decided to reduce the large number of hours spent data logging by focusing solely on the 1.0 GPM flow rates. This would streamline the extensive testing process by about 50%.
 Having just stated that we streamlined the testing process by 50%, we then doubled it. We wanted to know what impact, if any the grills and ABM had on thermal performance. To do this we removed the inner grill and ABM from the Eisbrecher Pro and called it “Modified”. We thought this should show up any performance impact when comparing data between the two. Additionally we ran the regular XT45 so we have “apples to apples” comparisons between 3 XT45 variants: regular NexXxos version, Eisbrecher Pro Modified (single grill each side with out ABM) and the regular Eisbrecher Pro which has both grills and the ABM.
A performance metric of critical importance is the delta between the warm coolant temperature and the cool ambient air temperature going into the radiator. Given that the system is well insulated, in equilibrium and we know the heat input to the system then we can also calculate some other very important numbers. The most useful for the end user is the amount of power being dissipating from the coolant during it’s pass through the radiator. That amount is what we refer to as Cooling Ability and is typically displayed with 1°C or 10°C Delta T as a reference point. The latter being more useful and is a good target for users to aim for when testing their loop. This W/10DT or W/10ΔT is the calculation used for our thermal performance assessments and comparisons.
Let’s take a look at the Delta T results from the tests, firstly plotted with extrapolation and followed by bar charts. Note that the extrapolation of the curve is much more sensitive to error than in the tested range. What we have here is essentially a DeltaT comparison of Push Only Vs. Push/Pull at 1.0 GPM.
 The modified version looks very similar, but with lower deltas for the same fan speed.
 I was not too concerned about the actual delta numbers in the test rig, but instead the trend pattern. As we should expect, the deltas come down significantly as the fan speed is increased.

 Delta T results (as above) are not always helpful when thinking about how many radiators you would need to cool your system. Instead it’s more useful to know the metric of W/Delta C. This metric is plotted below. It tells us how many Watts are dissipated by the radiator when the coolant rises 10C above ambient temperatures (W/10ΔT).
1st up the Eisbrecher Pro.
 Now the Modified version.
Here we see the same trend pattern as fan speeds increase, but take a look at the numbers in comparison to those above. As we suspected the mesh and extra grill is indeed hindering performance on the Eisbrecher Pro.
 Let’s make it a bit more interesting and combine both the data for the Eisbresher Pro and our Modified version onto the same bar chart for a side by side comparison.
 At every single data point we can easily see that the Modified Eisbrecher outperforms the standard Eisbrecher. The ABM simply is not doing what it claims.
This same data can now be plotted onto charts so that an end user can interpolate their own fan speed. Note again that the extrapolation of the curve is much more sensitive to error than in between the tested range.
As the sampling was reduced to only 1.0 GPM we don’t have the different flow rate comparisons in Push/Pull, but we do have the data to compare the Push Only Vs. Push/Pull in an “apples to apples” fashion.
Again the standard Eisbrecher Pro is first.
 The average difference between Push Only and Push/Pull results at the same fan speed for the Eisbrecher Pro was ~13.0%, and ranged from ~18% at 750 rpm to ~8% at 1850 rpm.
Now the Modified version.
 On the Modified version we found the average difference between Push Only and Push/Pull results at the same fan speed increased to ~16.5%, and ranged from ~18% at 750 rpm to ~14% at 1850 rpm.
From this data we can say without a doubt that the ABM (and extra grill) is impacting the Eisbrecher Pro performance. Additionally we can state that the ABM impact was greatest with the lowest fan speeds which resulted in weaker thermal dissipation (performance). This is totally opposite to Alphacool’s claims about the ABM. Alphacool state “that the radiator is especially effective with slow-revolving fans in comparison to normal radiators.” Our results show this not to be the case at all.
Let’s analyze that data some more…
![]()


I’m guessing they had to add the ABM cause the rads enclosure was generating noise as the fans pushed air through it.
Comments are closed.