


Again Please NOTE: Since our massive Radiator Round Up was completed, the thermal testing rig was retired and parts pulled from it for use in other projects. However, the rig was recommissioned for two reviews, but after several days testing we were never able to get the same calibration on the rig. Therefore we are not able to compare (apples to apples) these recent results with data previously recorded. Because of this we re-tested a couple of radiators with the new calibration so that we do have some results to compare the ST30 X-flow against. However in order to save time with these retests we streamlined the testing and stripped out the 0.5GPM and 1.5GPM Push/Pull tests.
This table shows the ST30 X-Flow’s W/10ΔT numbers at 1GPM in a quick glance chart format.
We have striven from the beginning of our radiator testing to achieve a test error margin of 1% or less. Initially we ran tests for months to verify data was accurate and repeatable before we commenced testing to publish the results. With our test equipment and methodology we believe we produce the most accurate data available for PC radiator thermal dissipation.
Push Only Data vs Competition
Focusing on the Push Only results for now, we’ll get to the Push/Pull data later. Keep in mind that the ST30 is the only radiator of the group that we should really compare against as the others have cores which are twice as thick.
Let’s start with 750 RPM and see how the ST30 X-Flow compares.
 The ST30 X-Flow finished in the lower half of our small test field for Push Only at 750 RPM. The regular ST30 was the winner being ~9.5% ahead of the X-Flow at this data point.
One challenge a X-Flow radiator faces is keeping the fluid turbulent in the tubes. This can be achieved by using thinner tubes, however the ST30 X-Flow tubes are 1.9mm wide which is a pretty standard size, in fact the same size as the regular ST30. If the flow rate through the tubes in not sufficient, the flow could become laminar. Laminar means that the fluid is running parallel or straight through the tubes and only the coolant in direct contact with the tubes is being cooled effectively. We want turbulent flow at all times where the coolant is mixing around as it passes through the tubes.
We have no way of knowing for sure how the coolant is interacting (or not) within the tubes, but it may offer an explanation for the results we are seeing here. Remember that a 1.0 GPM system flow rate equates to 0.5 GPM flow rate through a X-Flow radiator, assuming it has a single layer core such as the ST30 X-Flow.
Again we have no evidence of laminar flow being an issue here, but it is possible and something to keep in mind particularly if you run low flow rate systems do to lack of pump power, running pump at low rpm, or have a very restrictive loop.
Another simplistic way to think about an x-flow version of a radiator is that the coolant spends less time in the radiator for the same flow rate. This means that at high air flow the difference should be minimal in performance because the coolant is already fully cooled to ambient before it leaves the radiator. However this might imply that a radiator with shorter flowpath is better – but as we already see in this data the performance is lower at low air speeds. At lower air speeds the coolant is not fully cooled so the more time it spends in the radiator the more cool it gets. There is some optimal balance in the amount of time the coolant should spend in the radiator and that will vary with air flow and coolant flow rate. Most manufacturers have gone with a a dual pass design, while other x-flows and quad and hex pass radiators designs have shown that other designs can work with similar results.
Now let’s look at 1300 rpm:
 For Push Only 1300 RPM again the ST30 X-Flow is in the lower half of the pack. The regular ST30 has relinquished it’s lead and is now just ~5% ahead of the X-Flow version.
Now 1850 rpm Push Only:
 At 1850 RPM the ST30 X-Flow places last but is now only ~2% behind the regular ST30. The other 2 radiators are both 45mm thick so we didn’t want to comment on comparisons against them, but you may have noticed in the 750 RPM and 1300 RPM plots that the ST30 X-Flow was ahead of the thicker and much more expensive Eisbrecher Pro. We have our theories on the poor Eisbrecher performance and will no doubt be discussed in our upcoming Eisbrecher Pro review.
While not a stand out performer in then Push Only comparisons, the ST30 X-Flow did produce acceptable results, and it’s comparative performance against the same thickness radiator improved as the fans speeds increased. This matches our expectations.
One more chart to share for Push Only. Here we have plotted the ST30 X-Flow against the ST30 and XT45 at 1.0 GPM.
 This shows us that for all the Push Only fan speeds we tested at 1.0 GPM the ST30 X-Flow is really not too far off the pace.
Now let’s find out how it performs with Push/Pull fans.
Push/Pull is the most unlikely installation scenario for the ST30 X-Flow. It’s a set-up which we would not recommend using for any Slim radiator. The benefits of Push/Pull on a slim rad aren’t great enough to warrant the extra space and cost required for the additional fans. If you have 80mm of space available (slim rad + 2 fans) we would advise investigating a thicker radiator with a Push Only fan assembly.
Push/Pull Data vs. Competition
Again only the 1.0 GPM comparison results are being displayed due to the trimmed down testing regime that was implemented.
Firstly the 750 rpm:
 The ST30 X-Flow places 1st in the Push/Pull low fan speed beating not only the regular ST30 but also the thicker XT45. This seems to be a sweet spot for the X-Flow. While the single pass definitely seems to be working in the ST30 X-Flow’s favor at this data point we did not expect the X-Flow to out perform the regular ST30. However the radiator test rig has sometimes produced some unexpected results that were repeatable and consistent at this one test point. The HWLabs “Optiflow” vs Reverse flow come to mind – results that theory say should perform worse but at only this one data point perform better. With a 4% delta between the two results it is larger than the expected margin of error and it is repeatable so we do not believe that it is simply error. As we mentioned before there is an optimal amount of time for the coolant to be in the radiator for each combination of air and coolant flow rate. Perhaps this just happens to be the most optimal for the x-flow.
 At 1300 RPM Push/Pull the regular ST30 has gained ground on the X-Flow where they are now virtually equal. This bring us back to the idea that at high enough airflows these two radiators should perform identically.
Now 1850 rpm:
 I have to admit I find very the above chart very interesting when we compare the ST30 and ST30 X-Flow. Remembering that they both have an identical cooling package (core) and only the flow path through them is different. The X-Flow’s single pass slight advantage with low fan speeds has disappeared now and we can safely say that the two models have equal cooling potential at this data point.
We think this gives validity to the other test point’s data even though they may have seemed unusual at times. As the rig was calibrated identically for each radiator we see matching results for the same core as it approaches it’s cooling capacity, even though it is on different models with completely different flow paths.
Lastly for Push/Pull we have again plotted the ST30 X-Flows results against some of it’s fellow Alphacool stable mates.
 While we saw some separation in the Push Only plot, here we see the X-Flow going toe-to-toe with regular ST30 and the XT45 only gains any real advantage with high fan speeds.
Let’s now place the data for Push Only and Push/Pull at 1.0 GPM for each fan speed together so we see both sets of results on the same plot. Sometimes these combined plots show up some points of interest even though it is a repeat of data we have already looked at separately.
Again the 750 rpm first:
 It is a small test group of just five radiators so perhaps the results here are exaggerated somewhat, but these plots really can show a radiator’s strengths and weaknesses. In the above plot for example the ST30 X-Flow has a 1st place and a 2nd last place.
 So, no real surprises there given it is a repeat of data, just bundled together.
From all the 1.0 GPM test results we created “Average Performance Factor” charts for both Push and Push/Pull. We then made a combined plot of the average called the “Master Performance Factor”. The radiator with the best cooling ability (W/10ΔT) at each RPM was awarded a score of 100. Each other radiators W/10ΔT result was scored as percentage of the top performer.
This way of looking at the comparison takes away any advantages that a radiator may have at higher or lower fan speeds and looks at an overall average. While this appears fair it does tend to favor those radiators that are all-rounders and those radiators which do very well at high RPM. Most users should be more focused on their specific use case.
The following table shows the ST30 X-Flow’s percentage scores at each data point.
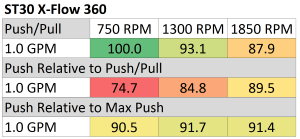
As the percentage scores in the table above are relative to the best performer at each data point, we again advise readers to cross reference specifications and results for each radiator and keep in mind your intended fan assembly and operating speed.
The percentage numbers above offer another way of comparing the ST30 X-Flow’s results. But for our scoring system we need a way to reduce the categories while retaining the data. To do this we average the results for each fan assembly type giving us Averaged Performance Factors. We calculate this for Push Only, Push/Pull and finally an average of everything. Again only the 1.0 GPM data has been used.
Firstly – the Push Only APF:
 It really is only fair to compare the ST30 X-Flow against the regular ST30 because both the XT45 variants and our modified version have cores which are twice as thick. Having said that, keep an eye on the Eisbrecher Pro placings in comparison to the ST30 X-Flow in these plots. The weaker Push Only performance of the X-Flow meant that it finished 5.5% behind the regular ST30.
Now the Push/Pull APF:
 In the Push/Pull APF the ST30 X-Flow turned the tables and finished with a slightly higher Push/Pull result than the standard ST30 thanks to it’s stronger performance with low speed fans.
Finally for thermal performance we created the Master Performance Factor which is calculated from the averaged results of all the Push Only and Push/Pull thermal tests at all fan speeds with a 1.0 GPM flow rate.
 The MPF result of 92.4 places the ST30 X-Flow just behind the regular ST30 and just over 5% behind the leading rads with a 33mm thick core. We reckon this is a pretty darned good result for both of the ST30 variants considering they have half the core thickness (16mm) of their bigger XT45 siblings.
Space Efficiency
The ST30 X-Flow’s space efficiency vs. performance should result in a high score because it is the equal thinnest of the group. We have used the Average Performance Factor results from the charts above to compile two plots which shows us how it compares to the other radiators in terms of performance Vs. space taken.
Firstly is radiator thickness Vs. APF
Here the combined APF scores were divided by the only radiator thickness, with the highest (most space efficient) issued a score of 100. Each of the other radiators results was converted to a percentage of the most space efficient radiator’s score.

The results certainly favor the two slim radiators with the X-Flow just being beaten by the regular ST30.
Next we took the APF results for Push/Pull and divided it by the total thickness including the fans and applied the same scoring system. For the Push Only we used the Push Only Vs Push/Pull comparative results and applied the same scoring system when compared against the Push/Pull.
The rankings are ordered for Push Only as that is the most efficient fan assembly and each radiator’s Push/Pull result are placed un-ordered, just below it’s ranked Push Only score.
 This plot is likely the most useful for readers of the 2 plots for space efficiency even though it is harder to decipher, especially the Push/Pull rankings. With fan thickness factored in the ST30 X-Flow finishes 2nd for Push Only and 1st for Push/Pull.
Value Factor
While our APF’s are still fresh in mind, let’s now look at some performance results vs radiator price to show which of the 360mm radiators might offer the best bang for your buck. Each radiator’s combined APF scores were divided by the radiator cost and again we applied our scoring system of percentage Vs. the best performer of the category.
 The ST30 X-Flow’s Value Factor turns out very good indeed. Whatever the reason Alphacool have for pricing the X-Flow lower than the regular ST30, it helped it into 1st place for this metric.
Next Up – Summary!
![]()


Are there some thicker cross flow radiator on the market?
Alphacool also have x-flow versions of their other radiators such as the XT45 and UT60. If you want thickest I think the UT60 is the only choice out there 🙂
Is this the best cooling 30mm rad on the market? Thanks!
In general the Black Ice Nemesis GTS generally seems to perform the best out of any slim radiators though the tradeoff is that it’s very high restriction.
Does that cancel out their overall performance though (which seems excellent)? I would have thought for the vast majority loops the Nemesis GTS would still be the best choice when seeking a low RPM rad solution?
Not usually in my opinion, but if you are going to run a bunch in series with a weak pump, then yes it may.
In the 360mm size?
Comments are closed.