


The Thermal Data
Moving on from the restriction test bench the CoolStream XE 360 was loaded into the thermal test chamber for a series of tests – consisting of 3 flow rates, each having 3 different fan rpm rates tested. I felt the thermal test data was most important and which you as the reader would be most interested in.
Below is the final data results gathered from at least 2 data logging runs at each flow rate and fan rpm combination. The most stable 15 minute period from each logging run was used and then averaged with the other runs to obtain the data for the table below. A total of 16 temperature sensors were used in the thermal test chamber (8 air in, 2 air out, 3 water in, 3 water out) each take a reading every second and logged via a CrystalFontz unit. The data in the table below is the averaged results of the logging runs which has then been used to create all the plots and tables there-after.

The performance metric of critical importance is the delta between the warm coolant temperature in and the cold ambient air temperature in to the radiator. Given that the system is well insulated and in equilibrium and we know the heat input to the system then we can also calculate a very important number – that is the amount of power required to raise the coolant temperature 1C (or 10C which is more useful reference point).
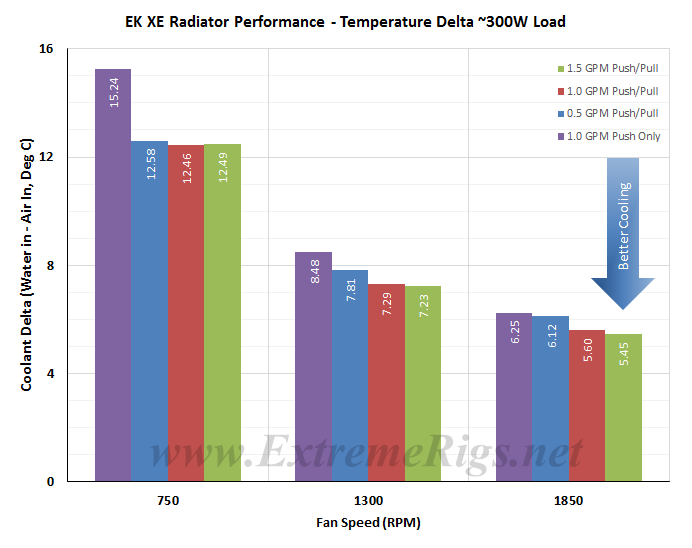
Let’s take a look at the Delta T results from the tests, in bar chart form first:

I’m not too concerned about the actual delta numbers here, more so if a trend pattern between fan speeds is occurring. Most noticeable here is the lack of variation between 1.0 and 1.5 gpm at the different fan speeds. Additionally it’s interesting to see the Push Only dropping so significantly as the fan speeds increase.
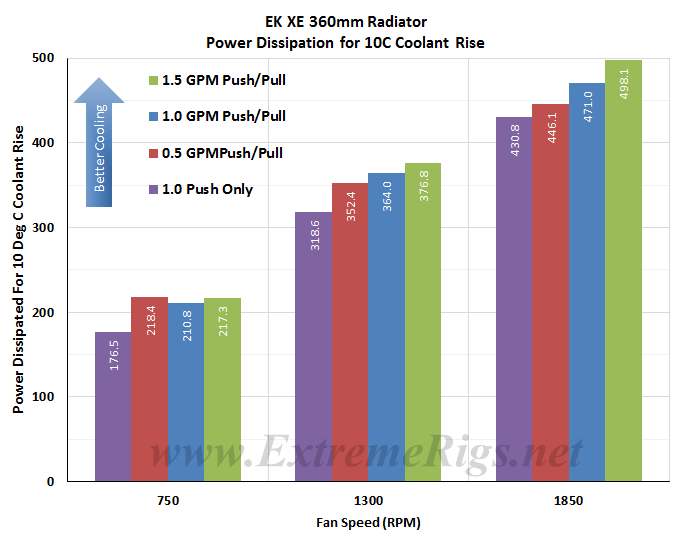
Delta T results (as above) is not always helpful when thinking about how many radiators you would need to cool your system. Instead it’s more useful to know the delta/W, or more usefully, the inverse metric of W/delta C. The metric plotted below tells us how many watts are dissipated by the radiator when the coolant rises 10C above ambient temperatures. (W/10 Delta T):

As expected increasing airflow through the radiator is the primary determinant in changing the radiators performance.
The unusual looking Push/Pull result at 0.5gpm 750rpm was re-tested twice, with the same (very similar) outcome. It is an unexpected result and doesn’t really make sense. With hindsight, I probably should have retested the 1.0 & 1.5 gpm 750 rpm data points again. However we’ll be averaging these flow rates later and that should help squash any error.
Notice that we are not seeing much performance gain at each fan speed as the flow rate is increased. This could prove interesting in the comparisons later on. Are the XE’s low flow results very good, or are the high flow gains lower than we would normally see?
This data can now be plotted as a pretty curve so that an end user can interpolate their own fan speed. Note again that the extrapolation of the curve is much more sensitive to error than in between the tested range. Let’s exclude the push data for now and come back to it:

Evidence again that increasing flow rate is yielding very little benefit in performance as the fan speed is increased. Note also the trajectory of the curve – this is a radiator that has “room to grow” with higher fan speeds and hasn’t ran out of breath.
If we now come back to the push data it’s good to compare the Push Only and Push/Pull data in an “apples to apples” fashion by only looking at the 1GPM data:

Push only gives around 87% (averaged) of the performance of the Push/Pull 1.0 gpm test results on this radiator. This is interesting as to date it seems to be the better performing radiators which have straighter lines like this with less curvature. It could be a promising sign for the XE.
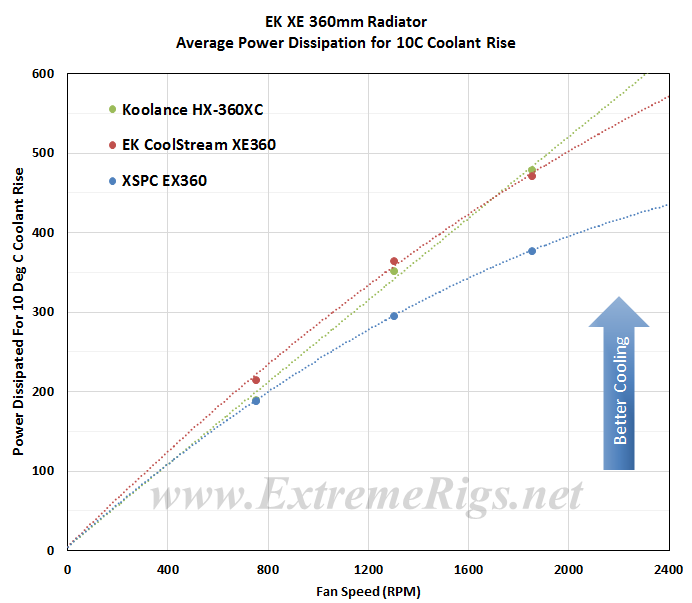
In this next plot all three Push/Pull results at each flow rate were averaged to produce one curve and we compared the results against one of the best and worst performers from the first test group. Averaging reduces test error of course so this helps further to be sure of our data and is more useful therefore for comparing to other radiators.

As you can see the XE clearly is beating both the reference rads at low fan speeds and only begins to taper off against the higher FPI Koolance rad once high fan speeds are reached.
Now let’s analyze that data some more…


Another great review of a great rad. Excellent work Fast Fate and EK.
Will have a couple of these on their way as soon as I can.
On your analysis page when comparing the average GPM @ 750/1300/1850 P/P your graph for this review differs from say the coolgate G2 review analysis numbers. Power dissipated on the G2 review page at AVE GPM 1850 P/P is 497.7 and in this review it shows the G2 @ 461. This discrepancy is across all radiators and fan speeds in your group A reviews, the power dissipated is much lower in this review.
I know you changed your temp reading set-up to get better accuracy but I never found anything referencing the change in Power dissipated due to that. Its confusing, could you please explain why the numbers changed.
BTY, always great reviews…..thank you!!
Good catch! Yes this is because for Group A we were using averaged power dissipation numbers across all of Group A. After publishing Group A and continuing analyzing numbers with Group B we found that repeatability was increased by using calculated power dissipation from each run rather than the average over all tests. Therefore all later numbers are processed using this method. Soon we will be going back and editing all the results to be consistent in the methodology 🙂
[…] EK CoolStream XE 360mm Radiator Review […]
[…] with the screws provided with the XE (which we reviewed last month) the short screws measured in at 6.5mm, just slightly longer than the 5mm as listed by […]
Thanks for the review.
This seems like close to the “ultimate” radiator it would seem.
Basically, this thing needs 2 things as you’ve noted:
– Screw protectors (this I think is a big oversight and would not be hard to integrate at all)
– A fill/bleed at the end (this I think is less important)
Otherwise, this is basically the ultimate radiator. I suspect that an 85mm version thick “Monster” variant of this would be able to outperform even the HWLabs GTX Black Ice.
Do you think that the louvered fins and higher tube count (14) are responsible for this radiator’s all around good performance?
Not sure if my commented posted earlier, but this is a repost.
It would seem that the ultimate radiator then would be a thicker variant of the XE 360mm. It’s interesting to note that this fan, despite it’s medium fin density, keeps up with all other radiators across the board.
Why?
– Perhaps the louvered single fin design is superior?
– I also note that it has 14 tubes, rather than the typical 12 tubes.
I’d be interested to hear your thoughts on that.
I would guess that a “Monster” radiator thickness (say 85mm or perhaps even 100mm) would be probably the ultimate radiator, especially if they could fit more tubes in.
I hope that in the future, EK will add screw protectors. That I think is a big oversight.
Anyways, thanks for the review.
[…] So EK have confirmed that dents will not turn into leaks – so if you have dents then feel free to carry on with your life. I am confused about the statement that only the 480 radiator is affected given that we’ve seen dents on other sizes. Still there is an option to RMA if you’re at all concerned. Hopefully this is the last we see of the issue because the XE is a great performing radiator! […]
[…] reviewed the 360mm version for the Extreme Rigs Rad Round Up 2015, so if the 360mm size is more your flavor be sure to check […]
Comments are closed.