


")
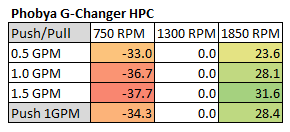
This first table shows the HPC’s Watts/10 Delta Temp numbers in a quick glance chart format. I chose to put the Watercool’s result table here as well for another comparison.


From these comparison numbers it would appear that Watercool have chosen to keep a higher performance version of the core for themselves, and licensed a slightly weaker performing version to Phobya – clever.
Using the data compiled from the Phobya HPC thermal testing I have compiled the following tables in an attempt to show other ways of how its performance varies against itself at the flow rates and fan speeds tested. Effectively these show percentage gains relative to a reference point. It’s an interesting way to show gains/losses while changing a variable.
First let’s focus on 1300 RPM as our reference and see how much gain or loss in performance we get by changing fan speed.

While 25-30% may seem like a decent change at first, it’s much less than some other radiators which is why the colors are quite neutral and not darker green or red. In other words the HPC radiator doesn’t scale too well with airflow.
In the next plot we focus on changing the flow rate with 1.0 GPM as the base line.
 Here we can see that as expected flow rate matters only a small amount, but matters most as airflow grows.
Lets combine both flow rate and fan speed as reference points and have a look at 0.5 GPM & 750 RPM as the reference point.
 Interestingly this plot shows a nice performance increase of 50% by upping the fan speed from 750rpm to 1300rpm with a constant 0.5gpm.
Lastly, we change the reference and choose our centre 1300 RPM and 1.0 GPM as our reference point to show both effects concurrently:

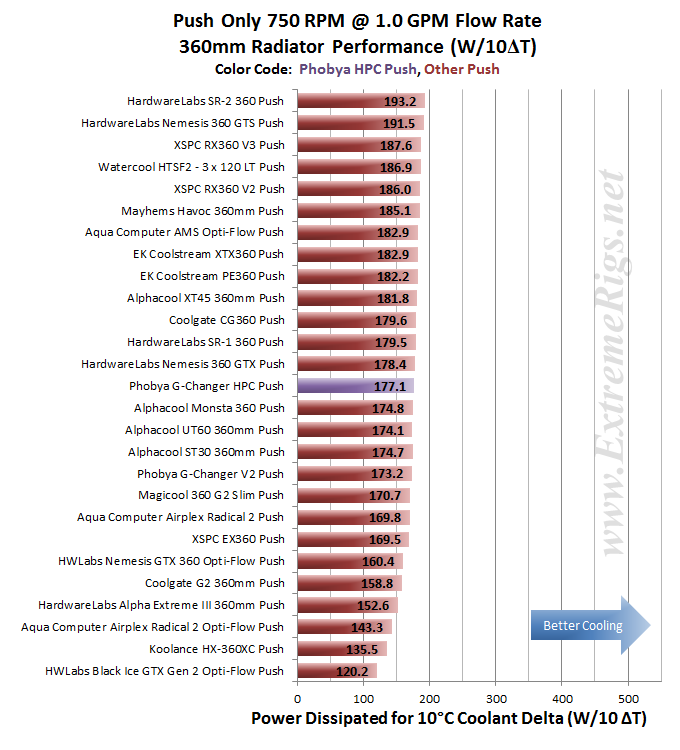
So from the data above we can get a very good idea of how the Phobya HPC radiator performs relative to itself. But there is a large selection of 360mm radiator models to choose from, released from numerous manufacturers. So, we need to start comparing performance between them. To see how the HPC performed against the other radiators tested, I have included the averaged flow rate comparison charts from the Round Up. We know that the flow rate has little impact on thermal performance so averaging of the 3 flow rate results gives us a good look at head to head performance at the rpm speeds tested at with even less error.
Push Only Data vs Competition
Let’s focus on the Push Only results for now and come back to the Push/Pull data later. While for Push/Pull we tested three flow rates, the Push Only testing was conducted only at 1GPM in order to save time.
Let’s start with 750 RPM and see how it compares to the competition:

The HPC finished in the middle of the pack for the 750rpm Push Only rankings, ~ 8.5% behind the winning rad.
Let’s see how jumping to 1300 RPM Push will change things:
 It seems the low fin count of the HPC has caused a dramatically drop in the rankings with the increased air flow. In reality of course the HPC still does better at 1300 rpm than 750rpm, but the other radiators performance improved much more dramatically with the increased air flow, leaving the HPC to fall behind. In 6th to last place the HPC is now 12.5% behind the category winner.
How will the HPC 1850 rpm comparison go ?
 At 1850 rpm Push Only the HPC dropped another position and a couple more percentage points.
So it appears (as perhaps expected due to low fin count) that the HPC is tuned best for low fan speeds and the Push Only testing is where it might have had its best comparison results.
Push/Pull Data vs. Competition
Let’s now look at the Push/Pull results and see how the HPC compares. For Push/Pull we have averaged the results from the 3 flow rates at which we tested.
 The HPC finished in the lower quarter of the group in the low fan speed Push/Pull category, ~12% behind the winning rad. This result came in lower than anticipated given the Push Only comparison was more favorable.
Let’s move to the 1300 rpm then as see how the HPC compares:
 In the 1300 rpm category the HPC holds position but falls further behind the leaders, now ~18% behind the category winner.
The averaged 1850 rpm results:
 At 1850 Push/Pull the HPC again holds position but is now ~22.5% behind the winner.
The next plots were put together using all the fan speeds at only the 1.0 gpm flow rate with both Push Only and Push/Pull fan assemblies so we can see where the HPC placed in the grand scheme of things. By now it should be clear what to expect but it’s interesting to directly compare Push and Push/Pull performance.
750 RPM and 1.0 GPM – Push & Push/Pull data merged:
 At 750RPM Push/Pull the HPC is just beaten by the top performing radiator with Push Only fans.
1300 RPM and 1.0 GPM – Push & Push/Pull data merged:
 At 1300 the Push/Pull results claws back to be ahead of all the Push Only results.
Finally let’s take a look at the merged data for Push and Push/Pull @ 1850 RPM @ 1.0 GPM.
 At 1850 we see a dramatic re-ordering with many of the top performing Push Only rads overtaking the HPC’s Push/Pull, while the HPC’s Push Only is now ahead of the worst performing Push/Pull.
From all of test results we created “Average Performance Factor” charts for both Push and Push/Pull and then a combined plot called the “Master Performance Factor”. The radiator with the best cooling ability (W/10ΔT) at each gpm/rpm combo was awarded a score of 100, and each other radiators W/10ΔT result was scored as percentage of the top performer.
This way of looking at the comparison takes away any advantages that a radiator may have at higher or lower fan speeds and looks at an overall average. While this appears fair it does tend to favor those radiators that are all-rounders and those radiators which do very well at high RPM. Most users should be more focused on their specific use case. Check in the Round Up for performance comparisons at every gpm/rpm combo for even more details and cross comparison results.
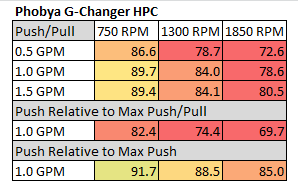
Here is the HPC’s Push/Pull performance scores at each data point that thermal tests were conducted at. Additionally we can see how the Push Only result compared against the winners at both Push/Pull and Push Only.

The large proportion of low numbers and red boxes confirm what was shown previously, that the Phobya HPC is not one of the top performers in the heat dissipation department. The 750rpm percentage numbers do appear better and that is where the HPC did perform better comparatively, but it must be remembered that all the results are low in this category, so the percentage numbers will be much closer also.
Then we started averaging the percentage scores at each flow rate giving us the Averaged Performance Factors of each radiator.
First – the Push Only APF:
 The HPC’s APF of 88.4% is respectable enough and puts in in the middle of the pack.
Focusing on Push/Pull, the weaker individual results meant that it fell down the rankings.

The Push/Pull APF sees the HPC places towards the bottom of the pack, only managing to beat the slim rads and the terrible performing Aqua Computer radiators.
Finally we created the Master Performance Factor which is calculated from the averaged results of all the thermal tests, Push and Push/Pull at all flow rates and all fan speeds.

In the Master Performance Factor comparisons the HPC placing is the same as the Push/Pull with a couple of extra percentage points which was boosted from it’s better Push Only results.
Next up – Summary!


[…] Koolance HX-360XC 360 Radiator Magicool G2 Slim 360 Radiator Mayhem’s Havoc 360 Radiator Phobya G-Changer HPC 360 Radiator Phobya G-Changer V2 Full Copper 360 Radiator Watercool HTSF2 3×120 LT 360 Radiator XSPC EX 360 […]
Comments are closed.