


The Thermal Data
Moving on from the restriction test bench the Aqua Computer Radical 2 was loaded into the thermal test chamber for a series of tests – consisting of 3 flow rates, each having 3 different fan rpm rates tested. I felt the thermal test data was most important and which you as the reader would be most interested in.
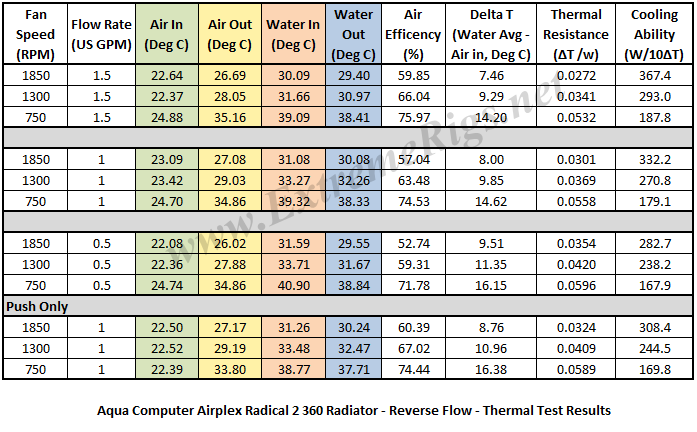
Below is the final data results gathered from at least 2 data logging runs at each flow rate and fan rpm combination. The most stable 15 minute period from each logging run was used and then averaged with the other runs to obtain the data for the table below. A total of 16 temperature sensors were used in the thermal test chamber (8 air in, 2 air out, 3 water in, 3 water out) each take a reading every second and logged via a CrystalFontz unit. The data in the table below is the result of the logging runs which has then been used to create all the plots and tables there-after.
The performance metric of critical importance is the delta between the warm coolant temperature in and the cold ambient air temperature in to the radiator. Given that the system is well insulated and in equilibrium and we know the heat input to the system then we can also calculate a very important number – that is the amount of power required to raise the coolant temperature 1C (or 10C which is more useful reference point).
First tested was the Reverse Flow:

At a later date the Radical 2 was reloaded into the thermal chamber with a slightly reconfigured tubing arrangement to accommodate the OptiFlow testing:

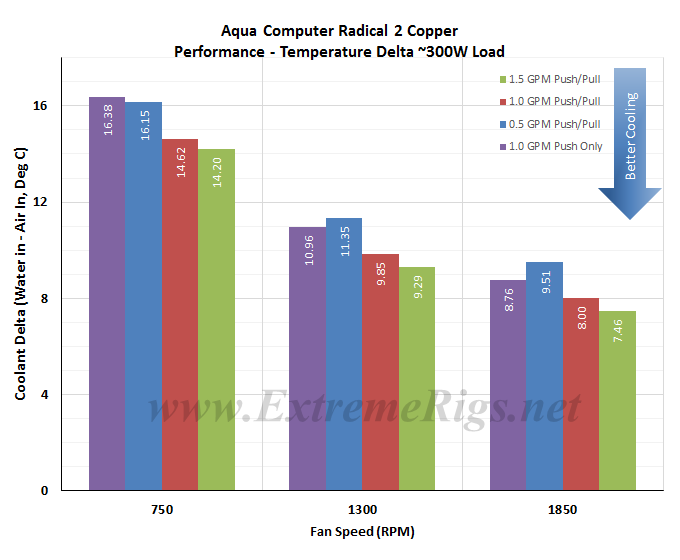
Let’s take a look at the Delta T results from the 2 tests, in bar chart form first with reverse flow:

Comparing the Reverse flow above to the OptiFlow results below we can see a similar pattern so probably not much to take out of this comparison. Of interest however is the lower temps achieved by the 1.0 gpm Push only compared to the 0.5 gpm Push/Pull with medium to high speed fans:
 Delta T results (as above) are not always helpful when thinking about how many radiators you would need to cool your system. Instead it’s more useful to know the delta/W, or more usefully, the inverse metric of W/delta C. The metric plotted below tells us how many watts are dissipated by the radiator when the coolant rises 10C above ambient temperatures. (10 Delta T):

This seems a good a spot as any to mention that the OptiFlow testing on all the radiators that could benefit from it produced some results that were not as expected. The AMS was no exception (as seen above) and despite numerous retesting the results left us bewildered at times at the data which was produced. The main cause for bewilderment was the calculated power dissipation result (Coolant Delta x Flow Rate x Heat Capacity) which is then used to calculate the overall performance metric (W/10DT). Some of the discrepancies we can attribute to error margins – that being uncontrollable fluctuations of the test rig such as power fluctuating which can effect fan speeds, flow rate and heater power. However despite many retests and even having a 1000 watt power conditioner between the wall and the PSU there is still something funky with the optiflow push data. I wish I had a proper explanation for some of these results, but at this stage unfortunately I do not. So I am going to present the data and try to ignore the abnormalities that may exist.

As expected increasing airflow through the radiator is the primary determinant in changing the radiators performance. However, in Reverse Flow we can clearly see dropping to the lower flow rate of 0.5 gpm has a negative effect on cooling performance. So much so that a Push only fan set up at 1.0 GPM outperforms a Push/Pull set up at 0.5 gpm. We’ve seen evidence of this low flow rate performance hit before, but never across all 3 fan speeds!
In the OptiFlow W/10DT plot the same low flow performance hit can be seen at high fans speeds in Push/Pull, but tapers off as fan speed was decreased. So OptiFlow shows up its first major difference. The variance in performance with all speed fans using Push/Pull is better, if by only small margins with OptiFlow
When we look at the Push only results though things change up a bit, with the 750 RPM Push only OptiFlow result being significantly lower than the reverse flow. This was a common trait with the OptiFlow radiators that could not be explained, and it wasn’t limited to the Delta T, the calculated power was significantly different for OptiFlow Push @ 750RPM that was consistent across many retests and remounts and radiators.
This data can now be plotted as a pretty curve so that an end user can interpolate their own fan speed. Note again that the extrapolation of the curve is much more sensitive to error than in between the tested range. Let’s exclude the push data for now and come back to it:
Reverse Flow first:

And the OptiFlow – the OptiFlow Vs. Reverse Flow data is so similar that when I tried a combined chart they pot lines just blurred over each other so I kept them separate.

Those plots make it easier to see that at higher fan speeds that a low flow starts to impact the cooling performance. This makes sense if you take it to the extreme and think about a very low flow rate where the coolant is already cooled 99% of the way to ambient with 10% of its journey through the radiator. In this example the radiator is not being efficiently used. 90% of the radiator surface area would then be wasted and you could have used a smaller radiator. Both coolant flow and air flow can limit thermal performance, however in typical systems flow is a much weaker effect than airflow due to typical choices of fans and pumps.
If we now come back to the push data it’s good to compare the push only to push/pull data in an “apples to apples” fashion by only looking at the 1GPM data:

In Reverse Flow, Push only gives around 92.5% (averaged) of the performance of the Push/Pull 1.0 gpm test results on this radiator. As we have seen, at high enough air flow that 1.0GPM Push does overtake 0.5GPM Push/Pull as the flow rate starts to limit performance.
In OptiFlow..well it’s one of those plots which is hard to explain. It seems illogical that a Push Only Fan set up could beat a Push/Pull set-up. Our testing never crossed that line, but the poly line points to a cross over at around 2300 rpm which I am inclined to write this off due to test error margins and inaccuracy of the poly line calculation when extrapolated:

Normally we see that the effects of flow rate changes are quite small, particularly at 1.0gpm and above, so in this next plot all three flow rate results were averaged together to produce one curve. Averaging reduces test error of course so this helps further to be sure of our data and is more useful therefore for comparing to other radiators.
Here one of the top performing and worst performing radiators have been plotted along with the Reverse Flow and the OptiFlow to see how the Radical 2 compares against them:

As you can see the Radical 2 in both flow paths performs far worse than the the worst performing radiator from the Group 1, testing at all fan speeds. In addition the direction of the radiator makes very little difference. This doesn’t bode well.
Now let’s analyze that data some more….


[…] 360 Radiator Alphacool ST30 360 Radiator Alphacool UT60 360 Radiator Alphacool XT45 360 Radiator AquaComputer Airplex Radical Copper 360 Radiator AquaComputer AMS 360 Radiator Coolgate CG 360 Radiator Coolgate G2 360 Radiator EK SE 360 Radiator […]
[…] just cannot dissipate the same amount of heat from the coolant as the other radiators. Quelle: Aqua Computer Airplex Radical 2 Copper Radiator Review – Page 5 of 6 – ExtremeRigs.net -> radikal schlecht Zitat von known user wenn die Masse NV anprangert, krieg ich […]
[…] […]
I have to say i fully agree with you on the mounting solution – it is utterly terrible. It took me and my brother working together to get this to fit in the top of my case (admittedly, it was a tight squeeze which doesn’t help). The fact that it doesn’t come with a full set of the fittings, means mine is supported by 4 on the top, and the other 8 holding fans on the bottom of the rad.
That aside, the cooling performance of this rad seems to be excellent for me – i have a d5 vario pump (usually running at 1000rpm), fx-8350 with EK waterblock, and this rad (3 x corsair sp120 + 2 x 200mm NZXT case fans. My temperatures are on average, below ambient. While on load, they peak at 35C. When overclocked, i have struggled to get it to go higher than 43C. Although this review suggests that other rads would lower these temps further.
Comments are closed.