


The Thermal Data
Moving on from the restriction test bench the Alphacool ST30 was loaded into the thermal test chamber for a series of 12 tests – consisting of 3 flow rates, each having 3 different fan rpm rates tested. I felt the thermal test data was most important and which you as the reader would be most interested in.
Below is the final data results gathered from at least 2 data logging runs at each flow rate and fan rpm combination. The most stable 15 minute period from each logging run was used and then averaged with the other runs to obtain the data for the table below. A total of 16 temperature sensors were used in the thermal test chamber (8 air in, 2 air out, 3 water in, 3 water out) each take a reading every second and logged via a CrystalFontz unit. The data in the table below is the result of the logging runs which has then been used to create all the plots and tables there-after.

The performance metric of critical importance is the delta between the warm coolant temperature in and the cold ambient air temperature in to the radiator. Given that the system is well insulated and in equilibrium and we know the heat input to the system then we can also calculate a very important number – that is the amount of power required to raise the coolant temperature 1C (or 10C which is more useful reference point).
Let’s take a look at the Delta T results from the tests.
 In this bar chart a couple of very interesting pieces of data show, those being the 1.0 GPM Push Only Delta Temps at 1300 and 1850 RPM. At 1300 rpm the 1.0 GPM Push Only is very close to the 0.5 GPM Push/Pull and Push Only even has a lower Delta Temp at 1850 rpm. This suggests that the second fan is of little benefit when run with low flow rates and medium to high fan speeds as the radiator becomes limited by the coolant flow more than the air flow. This also isn’t too surprising given that the radiator is so slim and doesn’t have high FPI so the benefit of additional fan pressure will be low anyway.
The above info is of course not an apples to apples comparison because of the flow rate difference, I found it interesting though as it is the first time I have seen Push only produce better data results than Push/Pull – even if only by the smallest of margins.
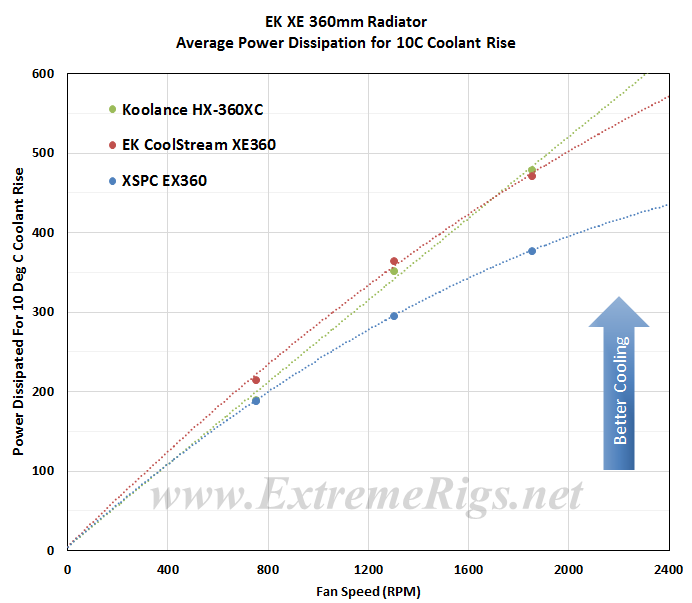
So the performance is not greatly affected by varying flow rate. However Delta T is not always helpful when thinking about how many radiators you would need to cool your system. Instead it’s more useful to know the delta/W, or more usefully, the inverse metric of W/delta C. The metric plotted below tells us how many watts are dissipated by the radiator when the coolant rises 10C above ambient temperatures. (10 Delta T):
 As expected increasing airflow through the radiator is the primary determinant in changing the radiators performance. We can see that the 1850 rpm Push only result outperforms the 0.5gpm Push/Pull results.
This data can now be plotted as a pretty curve so that an end user can interpolate their own fan speed. Note again that the extrapolation of the curve is much more sensitive to error than in between the tested range. Let’s exclude the push data for now and come back to it:

This makes it easier to see that at higher fan speeds that a low flow starts to impact the cooling performance. This makes sense if you take it to the extreme and think about a very low flow rate where the coolant is already cooled 99% of the way to ambient with 10% of its journey through the radiator. In this example the radiator is not being efficiently used. 90% of the radiator surface area would then be wasted and you could have used a smaller radiator. Both coolant flow and air flow can limit thermal performance, however in typical systems flow is a much weaker effect than airflow due to typical choices of fans and pumps.
If we now come back to the push data it’s good to compare only the push to push/pull data in an “apples to apples” fashion by only looking at the 1GPM data:

Push gives close to 89% (averaged) of the performance of Push/Pull across the range tested on this radiator. If you do combine all the plots you’ll also see that at high enough air flow that 1.0GPM Push does overtake 0.5GPM Push/Pull as the flow rate starts to limit performance.
In this next plot all three Push/Pull results at each flow rate were averaged to produce one curve and we compared the results against all of the slim rads we have tested so far. Averaging reduces test error of course so this helps further to be sure of our data and is more useful therefore for comparing to other radiators.
Push Only first up:
 And the Push/Pull Slim rad comparisons:
 The results for both fan assemblies are tightly grouped with the exception of the Koolance EK SE rads. The ST30 performs respectably with both low and medium speed fans, but tapers off a bit with the high speed fans.
Now let’s analyze that data some more…


[…] Monsta 360 Radiator Alphacool ST30 360 Radiator AquaComputer Airplex Radical Copper 360 Radiator AquaComputer AMS 360 Radiator Coolgate CG 360 […]
[…] ,finde ich den artikel von xtremerigs.net sehr interessant … im Vergleich nexxxos st30 und ut60: Alphacool NexXxos ST30 360 Radiator Review – Page 4 of 6 – ExtremeRigs.net Alphacool UT60 360 Radiator Review – Page 4 of 6 – ExtremeRigs.net da sieht man schon, dass […]
[…] interesting reference for some readers/potential buyers will be our review of the ST30 360mm which we published last year. While not a true 1:1 comparison because of the different […]
The ST30 looks fine for slower/medium speed fans of around 1,000RPM or below? Seems like it’s underrated if you ask me looking at those results..
Comments are closed.