


")
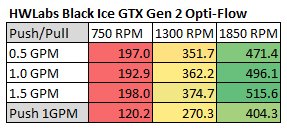
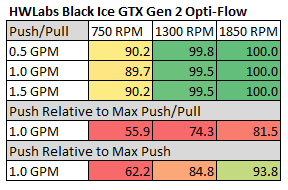
This first table shows the GTX’s Watts/10 Delta Temp numbers in a quick glance chart format.
Using the data compiled from the GTX thermal testing I have compiled the following tables in an attempt to show other ways of how its performance varies against itself at the flow rates and fan speeds tested. Effectively these show percentage gains relative to a reference point. It’s an interesting way to show gains/losses while changing a variable.
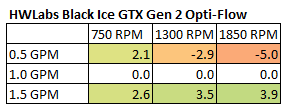
First let’s focus on 1300 RPM as our reference and see how much gain or loss in performance we get by changing fan speed.
 The high percentage changes between 1300 rpm to 750 rpm indicate a significant performance drop when the fan speed is reduced. Also we notice huge changes in the Push Only results on either side of the 1300 rpm reference.
In the next plot we focus on changing the flow rate with 1.0 GPM as the base line.
 With only slight percentage changes with adjustments to the flow rate could mean that flow rate is not a big determining factor for performance on the GTX.
How about we combine both flow rate and fan speed as reference points and have a look at 0.5 GPM & 750 RPM as the reference point.
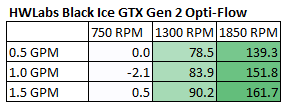 Massive performance boost is seen with each increase of the fan speed.
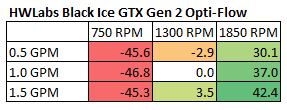
Lastly, we change the reference and choose our center 1300 RPM and 1.0 GPM as our reference point to show both effects concurrently:
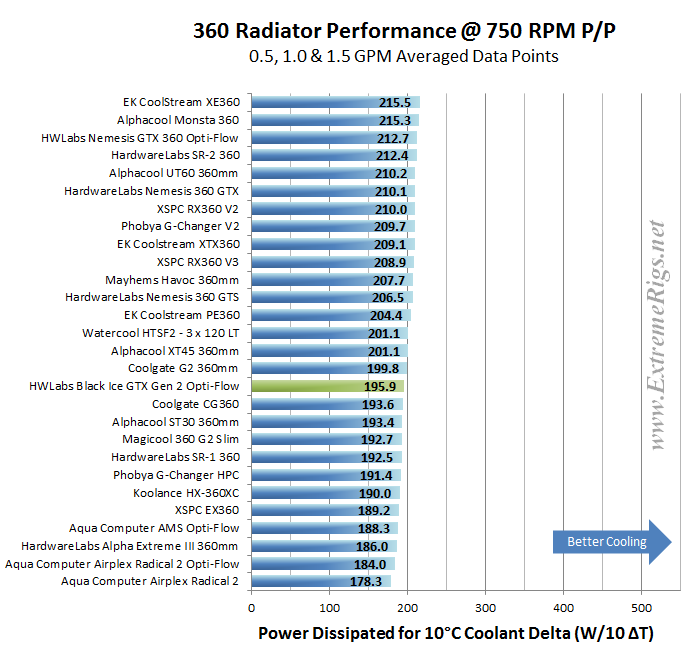
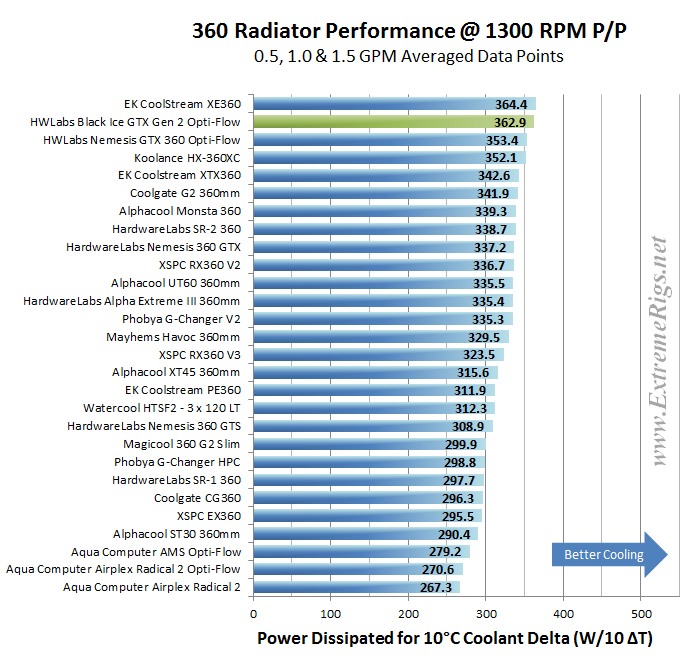
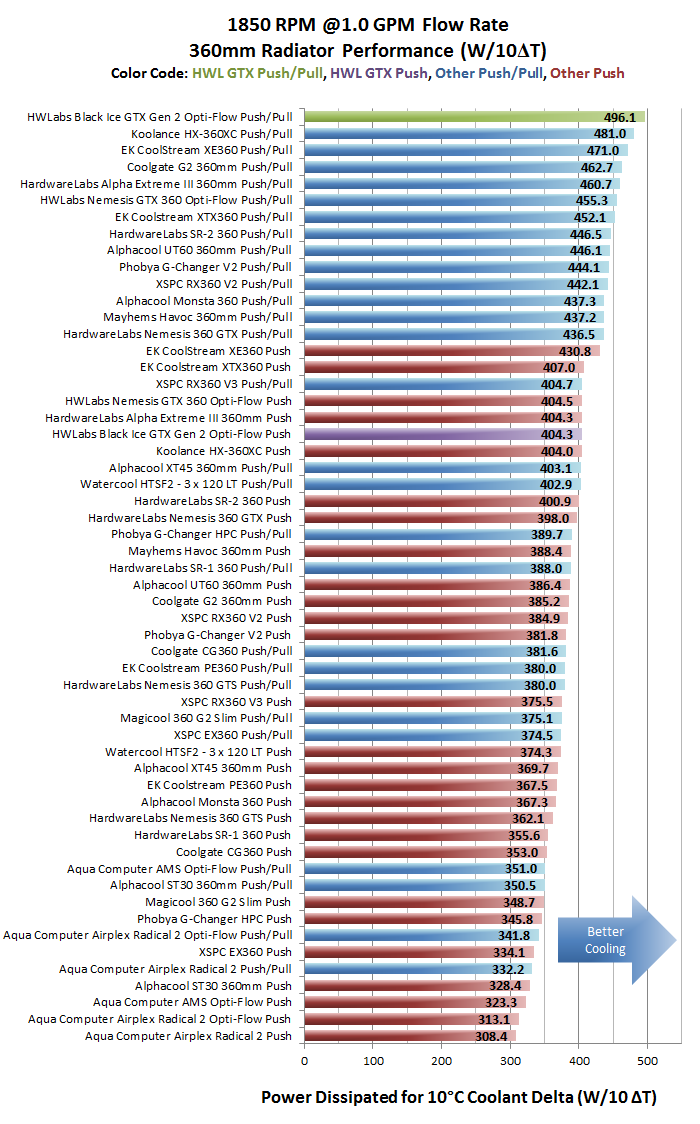
So from the data above we can get a very good idea of how the GTX radiator performs relative to itself. But there is a large selection of 360mm radiator models to choose from, released from numerous manufacturers. So, we need to start comparing performance between them. To see how the GTX performed against the other radiators tested, I have included the averaged flow rate comparison charts from the Round Up. We know that the flow rate has little impact on thermal performance so averaging of the 3 flow rate results gives us a good look at head to head performance at the rpm speeds tested at with even less error.
Push Only Data vs Competition
Let’s focus on the Push Only results for now and come back to the Push/Pull data later. While for Push/Pull we tested three flow rates, the Push Only testing was conducted only at 1GPM in order to save time.
Let’s start with 750 RPM and see how it compares to the competition:
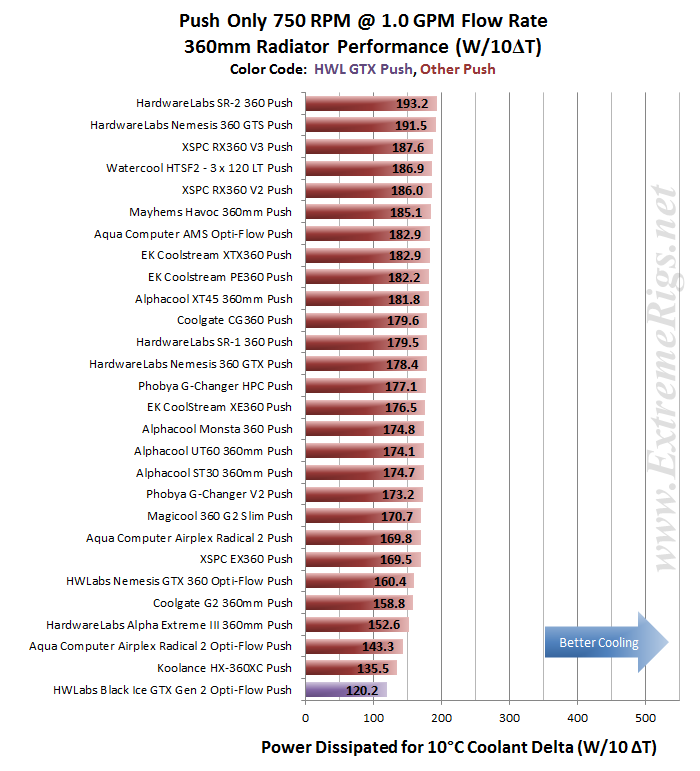 Dead last – with the lowest score of any data point of the entire group. There is no surprise here though. It’s thick dense core is not designed for this fan set-up, it fact being so bad could be a promising sign that it will perform really well at the other end of the scale (high speed Push/Pull)
How does the GTX do at Push Only 1300 rpm?
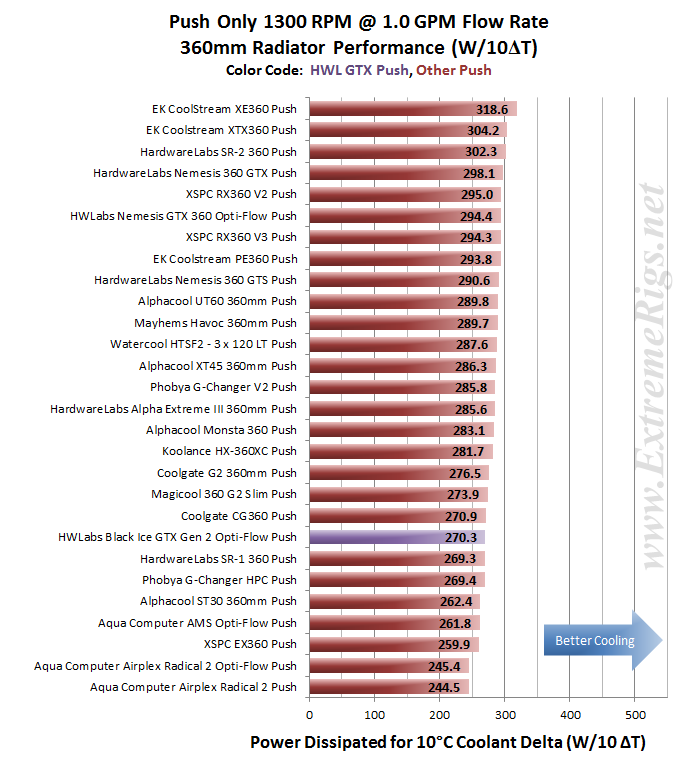 Some improvement, moving up the ranking, but is still 15% behind the winner.
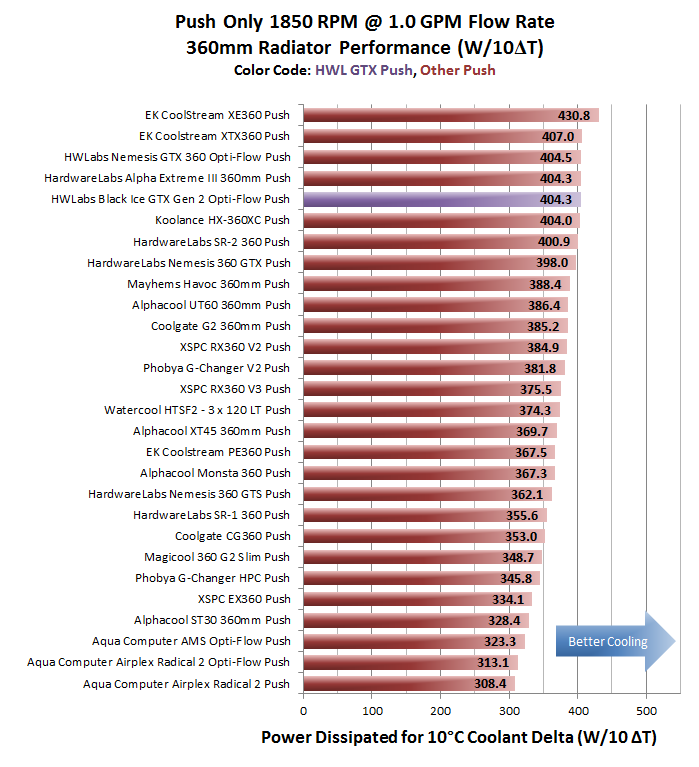 OK then, with the high fan speed the GTX is starting to breath, after having been choked in the previous results. In 6th place it is now just 1.5% behind the winner.
So it appears (as expected given the high FPI count) that the GTX is well tuned for high fan speeds. Will the GTX repeat the rising performance trend as fan speeds/air pressure are increased in Push/Pull?
Let’s find out…
Push/Pull Data vs. Competition
Let’s now look at the Push/Pull results and see how the GTX compares. For Push/Pull we have averaged the results from the 3 flow rates at which we tested.
 The GTX finished in 17th position in the Push/Pull low fan speed category, ~9% behind the winning rad. Certainly not as bad as the Push Only so this is a promising start.
Let’s move to the 1300 rpm then:
 In the 1300 rpm category the GTX jumped up the leader table to finish in 2nd, just ~0.5% behind the category winner. The 0.5% is within our test error margin so effectively placing the GTX equal 1st. The GTX placed second in each of the 3 flow rates making up the averaged 1300 rpm performance results.
The averaged 1850 rpm results…
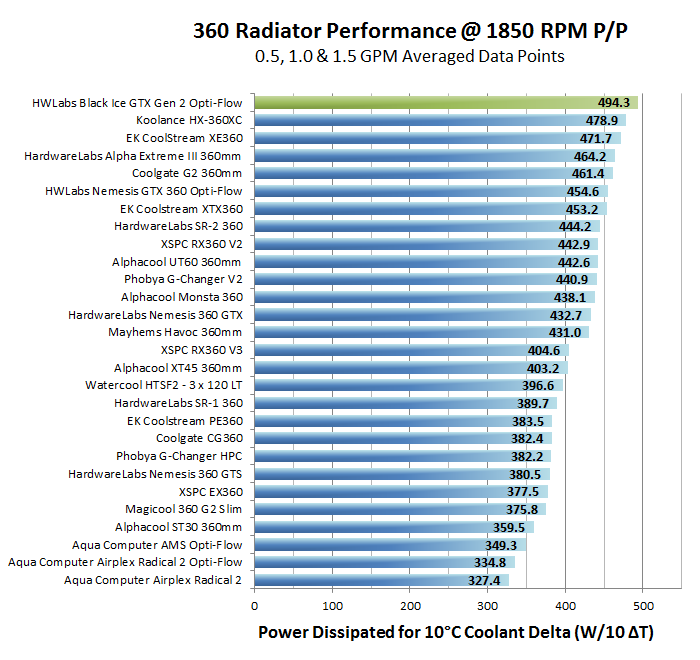 At 1850 Push/Pull the GTX jumps up for the category win, clear of it’s nearest competitor by ~3%. The GTX took out 1st place in each of the 3 flow rates contribute to the averaged 1850 rpm result. Clearly this is a radiator that still delivers when airflow is high enough!
Let’s also combine the Push and Push/Pull results at the 1.0 GPM flow rate into one plot for each fan speed tested. This can be interesting to help decide if if more fans or a different radiator is the better option if looking to improve performance.
Again the 750 rpm first:
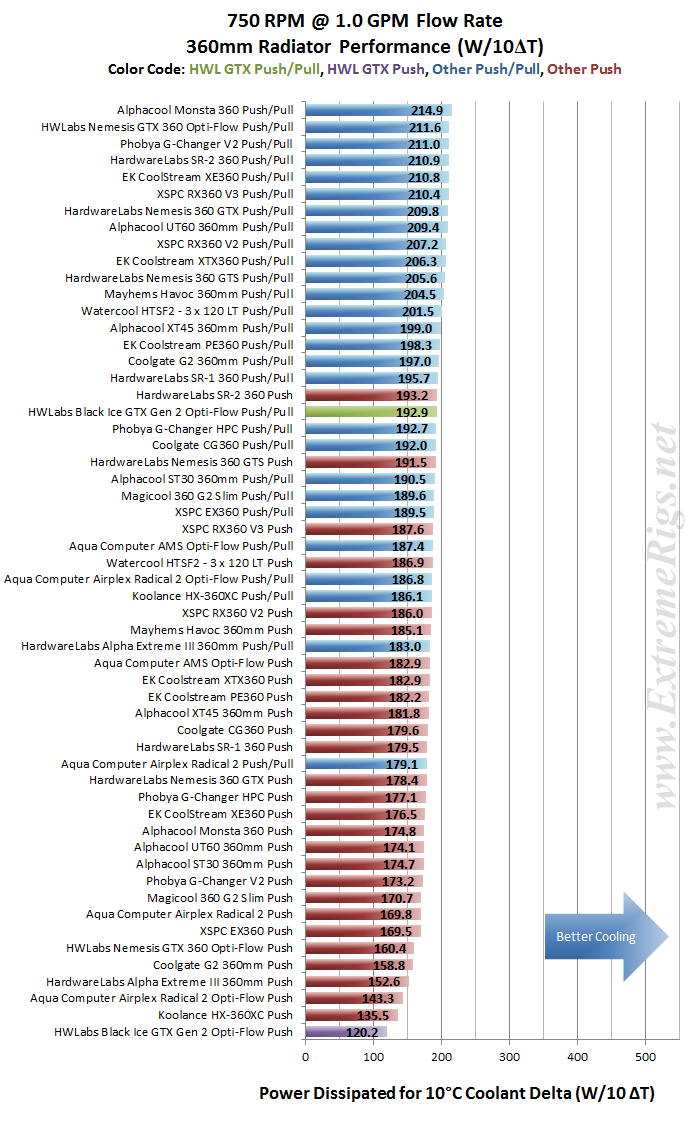 Nothing looks out of place here given the data we have reviewed already. Interestingly the GTX’s Push/Pull result is beaten by the top performing Push Only rad – the HWLabs SR2 which is optimized for lower fan speeds.
At 1300 rpm next:
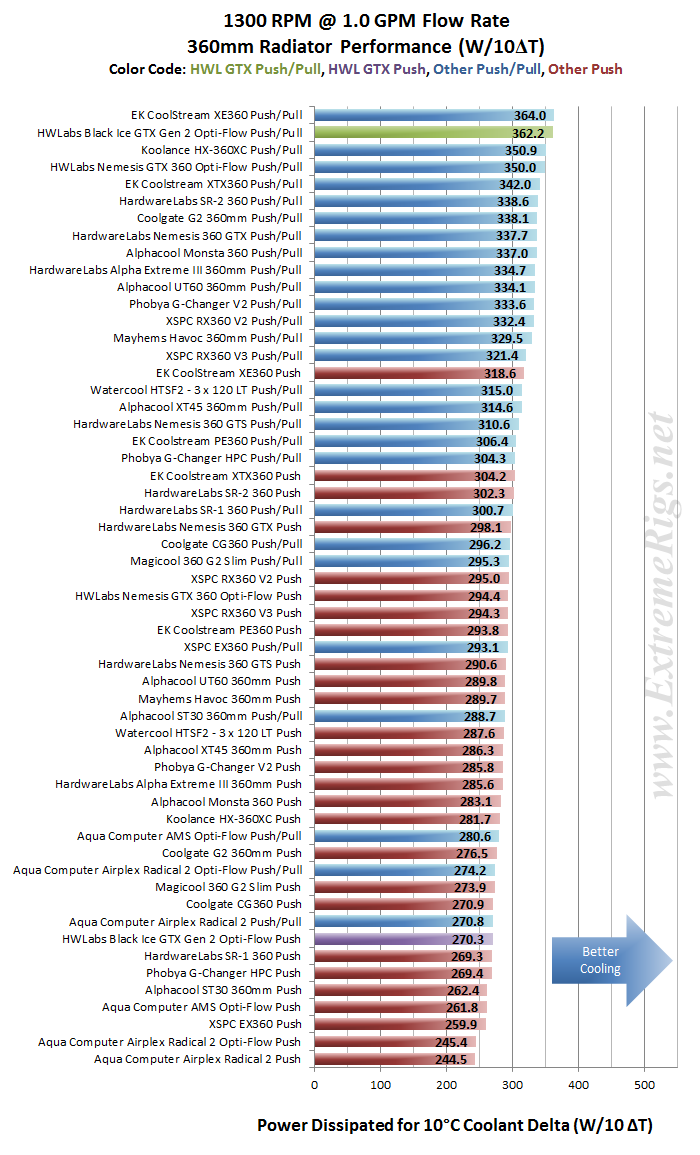 At 1300 rpm everything looks in order given the data we’ve already reviewed.
From all of test results we created “Average Performance Factor” charts for both Push and Push/Pull and then a combined plot called the “Master Performance Factor”. The radiator with the best cooling ability (W/10ΔT) at each gpm/rpm combo was awarded a score of 100, and each other radiators W/10ΔT result was scored as percentage of the top performer.
This way of looking at the comparison takes away any advantages that a radiator may have at higher or lower fan speeds and looks at an overall average. While this appears fair it does tend to favor those radiators that are all-rounders and those radiators which do very well at high RPM. Most users should be more focused on their specific use case. Check in the Round Up for performance comparisons at every gpm/rpm combo for even more details and cross comparison results.
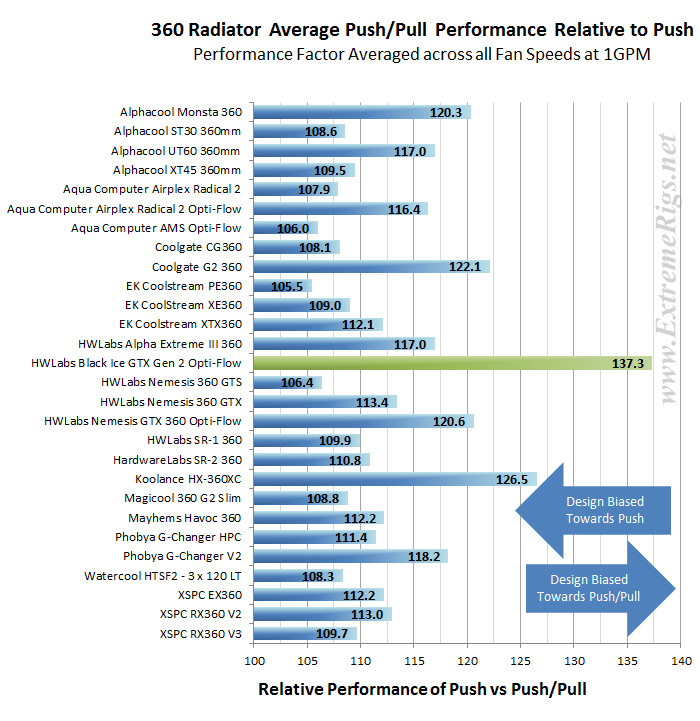
Here is the Black Ice GTX’s percentage scores at each data point that thermal tests were conducted at with the addition of the GTX’s Push Only results relative to the Best performing Push/Pull results
The Push/Pull medium and high fan speed results are impressive to say the least. It shows just how dominant the GTX was in then high speed fan tests.
Then we started averaging the percentage scores at each flow rate giving us the Averaged Performance Factors of each radiator.
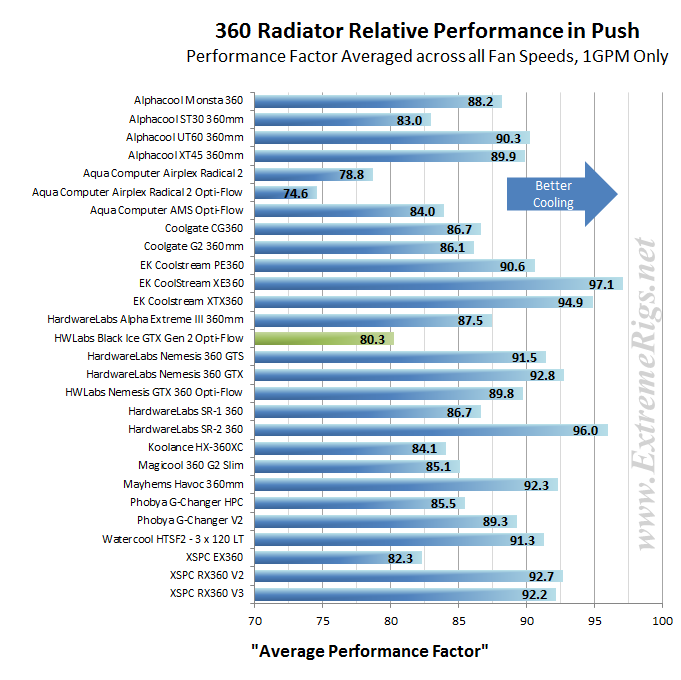
Firstly the Push Only APF:
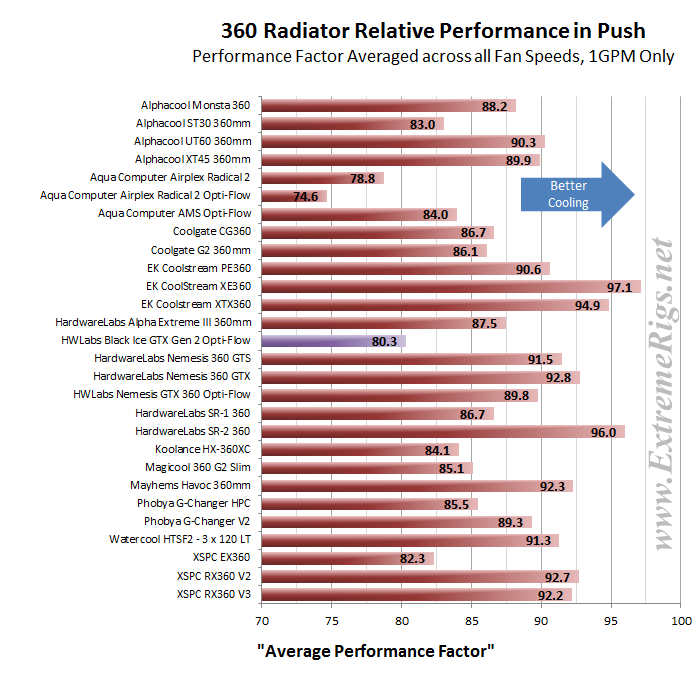
The GTX’s Push Only APF score of 80.3 is 3rd last of the test group. The High Fin count is obviously hindering performance with the low pressure provided by the Push Only fan assembly.
Now the Push/Pull APF:
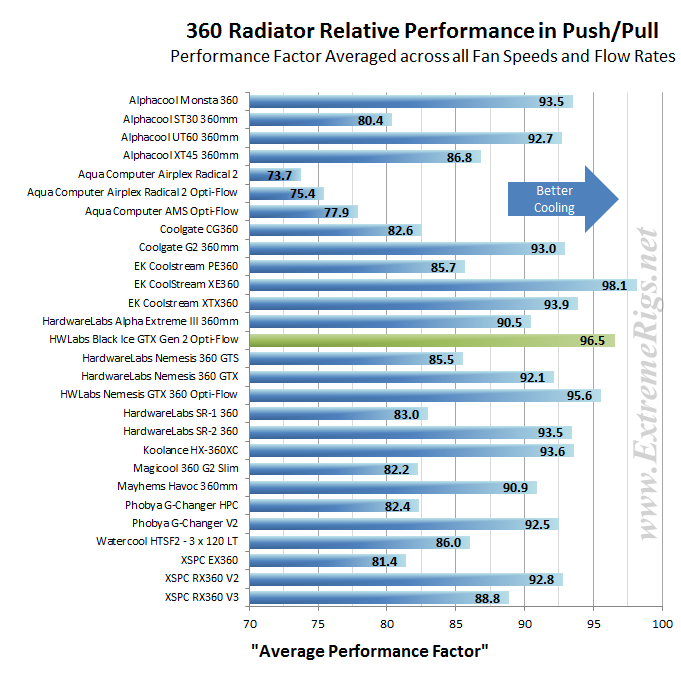
The GTX’s Push/Pull APF of 96.5 places it in 2nd position. The weaker 750 rpm results held back the GTX’s result as in the medium and high speed tests the GTX was dominant with 3 2nd places and three 1st places.
Finally we created the Master Performance Factor which is calculated from the averaged results of all the thermal tests, Push and Push/Pull at all flow rates and all fan speeds.
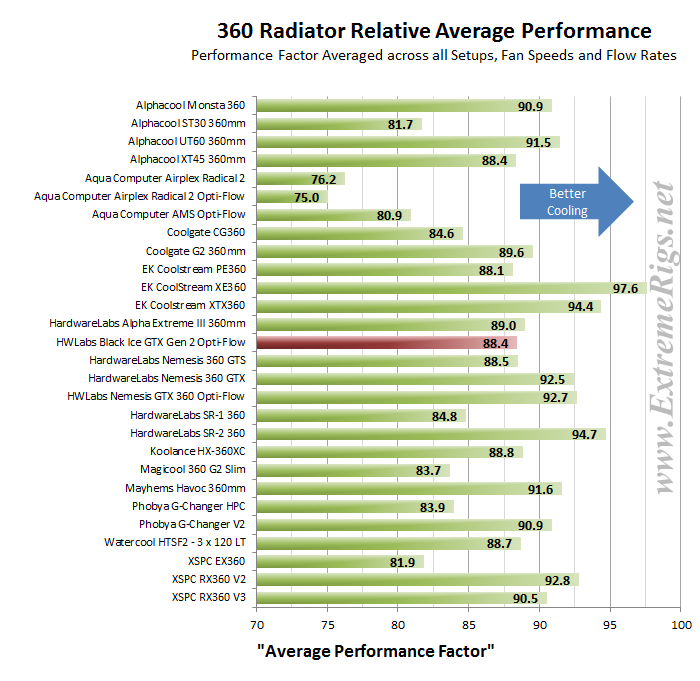
In the Master Performance Factor comparisons the GTX finishes in equal 16th place. The poor results with low fan speeds held back it’s overall score though dominating with medium and high Push/Pull fans.
These next couple of plots show quite nicely just how biased the GTX is towards high fan speeds or Push/Pull set ups with more air flow through the rad.
First the GTX’s Bias for Push Only…. it is almost laughable at the result that was generated. This is not a radiator designed to be run with push only fans!
 I really didn’t expect the GTX to perform well across the board. I suspected the dense core structure would equate weak performance in the Push Only tests, which the test data confirmed. Likewise The Push/Pull results didn’t surprise either, with a clean sweep of the high speed fan Push/Pull tests.
Next up – Summary!


[…] Hardware Labs Black Ice® GTX 360mm Radiator Review […]
Thanks for the review again.
I think that the issue of screw protectors again, seems to be a design flaw. This is a bigger problem with the GTX 360 than other radiators simply because it is a radiator designed for high rpm fans. By nature, you are far more likely to use 38mm fans with such a radiator in push pull for the added static pressure.
Otherwise, it’s a solid radiator.
I would love to see a “Monster” radiator with 20 fpi and a similar design, but I suspect it would be a niche product.
Keep in mind that the GTX is an older model and that what we now consider important features were not always incorporated a few years ago. The current generation of HWLabs offerings all feature protection plates.
If I am not mistaken though the Black Ice GTX Gen 2 though (the variant for high rpm fans in push pull) still does not have screw protectors.
The HW Labs site is currently down so I cannot look it up.
Hi, which fans can use with this radiator?
Any 120mm fans would work – but if you’re buying this rad we would assume it’s to make use of it’s higher performance with highspeed fans. So something in the 2000+RPM is probably the target.
this rad i already have it, can you suggest me 6 fan with low noise?
Thanks in advance
There is a definite intangible when it comes to fan noise. That intangible is the “ear of the beholder.” The quality of sound may not be the same to one listener as to another. This becomes more true when you start moving up to higher speed fans. Another thing to think about, if a fan is tested to emit 29 decibels of sound at 1500 RPM and you need 6 of these fans, each fan adds to the overall noise total. It is not linear, so not 29 dba * 6, it is more of a percentage. Throwing a number out there for sake of example, 6 fans together may emit a constant 38 dba at 1500 RPM. Mounting the fans can cause the noise quality to change. To answer your question with F_F target RPM (not in a specific order): Dark Side Gentle Typhoon 2150 RPM, Noctua NF-F12 Industrial 2000/3000 RPM, Noiseblocker NBe-Loop B12-P / B12-3 & B12-4, EK Vardar F4-120/120ER & FF5-120. A starting place at least.
Comments are closed.