


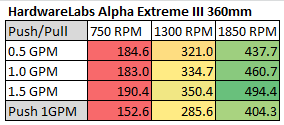
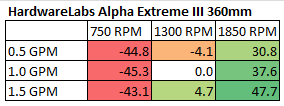
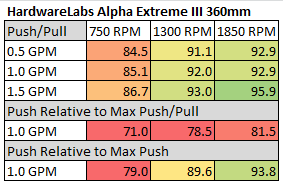
Using the data compiled from the Alpha Xtreme III thermal testing I have compiled the following tables in an attempt to show another way how the Alpha Xtreme performance varies against itself at the flow rates and fan speeds tested. First let’s start with the raw data:
 We then use this to show percentage gains relative to a reference point. It’s an interesting way to show gains/losses while changing a variable. This first table shows performance gain or loss relative to 1.0GPM flow rate:
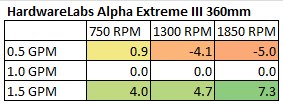
This shows that increasing flow to 1.5GPM has little gain while lowering flow to 0.5GPM does affect performance more.
We can also focus on 1300RPM as our reference and see how much gain or loss in performance we get by changing fan speed:
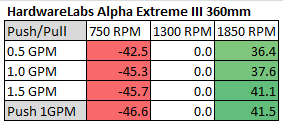
As expected the change is dramatic. Unexpectedly this rpm based plot shows up quite well how the Xtreme III is affected by change in the flow rate. This plot references 0.5gpm & 750rpm:
It shows quite well that increasing flow rate has a small, even negative impact on the Xtreme III’s thermal performance. At the same time it shows percentage increases of the different gpm/rpm combos tested.
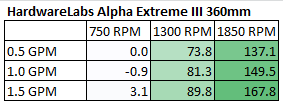
Lastly we can combine both and choose 1300 RPM and 1.0 GPM as our reference point to show both effects concurrently:
So from the data above we can get a very good idea of how the Alpha Xtreme III radiator performs relative to itself. But there is a large selection of 360mm radiator models to choose from, released from numerous manufacturers. So, we need to start comparing performance between them. To see how the radiator performed against the other radiators in this group I have included the averaged flow rate comparison charts from the Round Up. We know that the flow rate has little impact on thermal performance so averaging of the 3 flow rate results gives us a good look at head to head performance at the rpm speeds tested at with even less error.
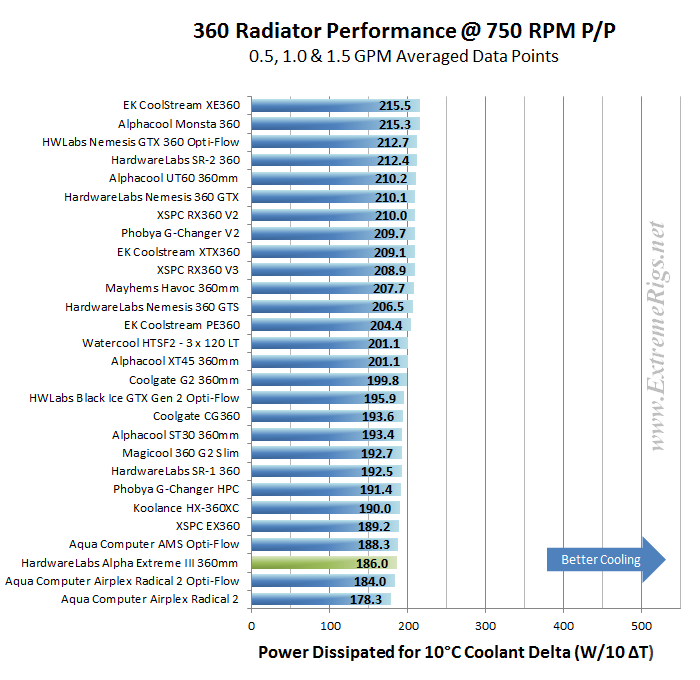
Let’s start off with the Push only results first:
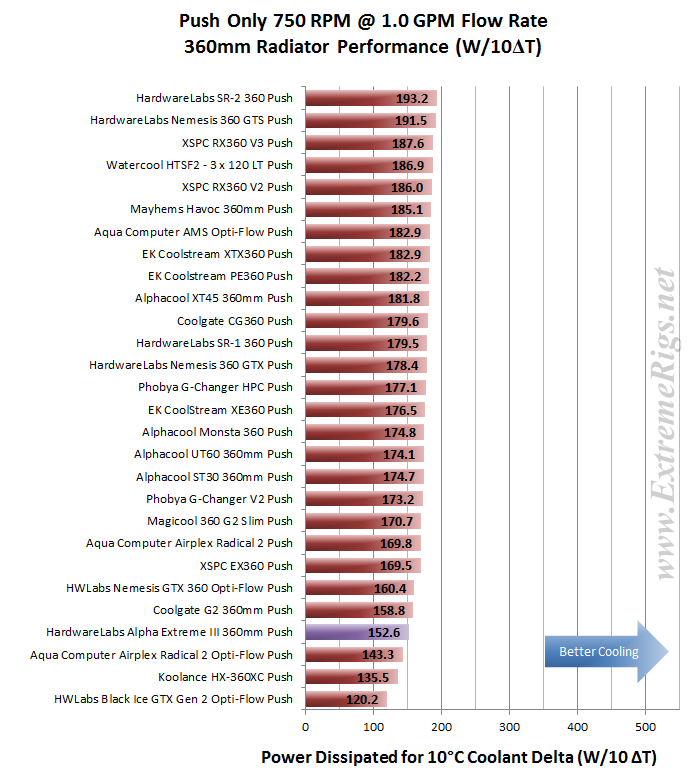
The Xtreme’s high FPI meant that the 750RPM result was almost guaranteed to be poor.
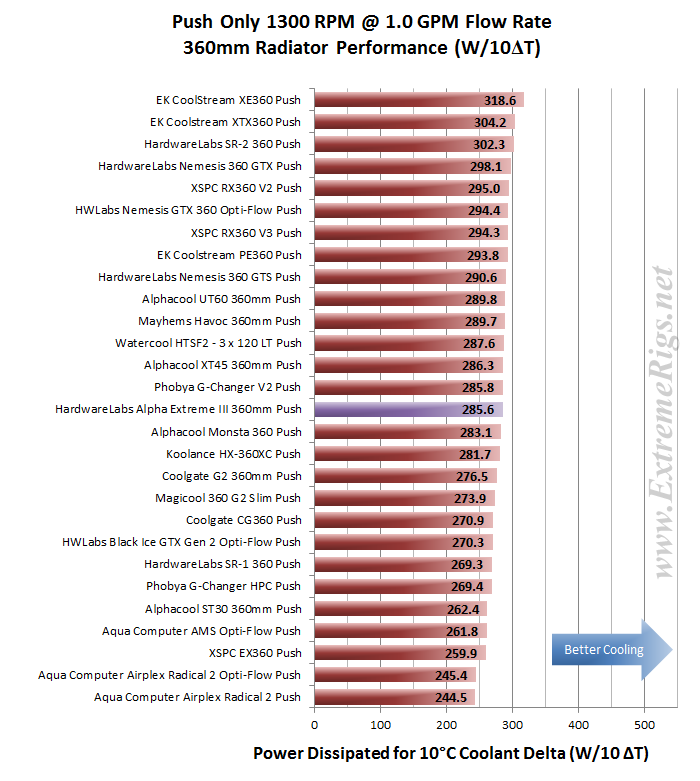
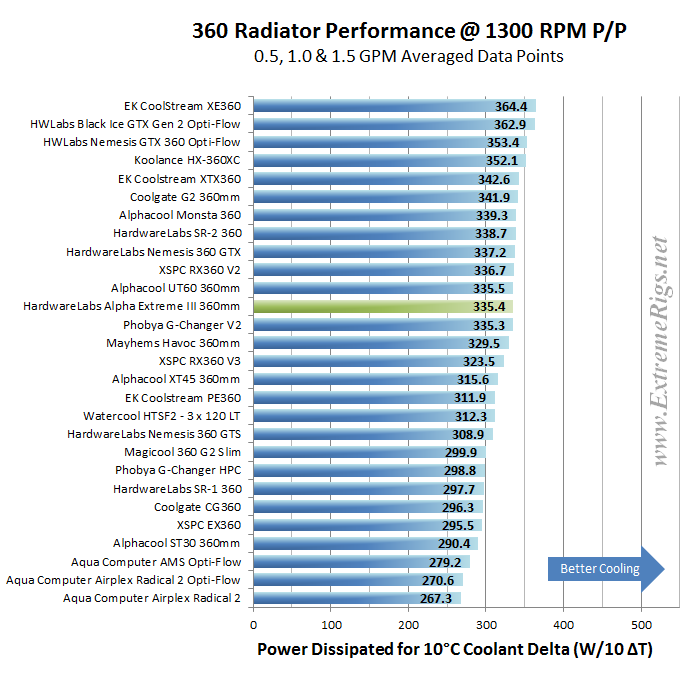
At 1300RPM the AXIII is moving up through the field and is now firmly in the middle.
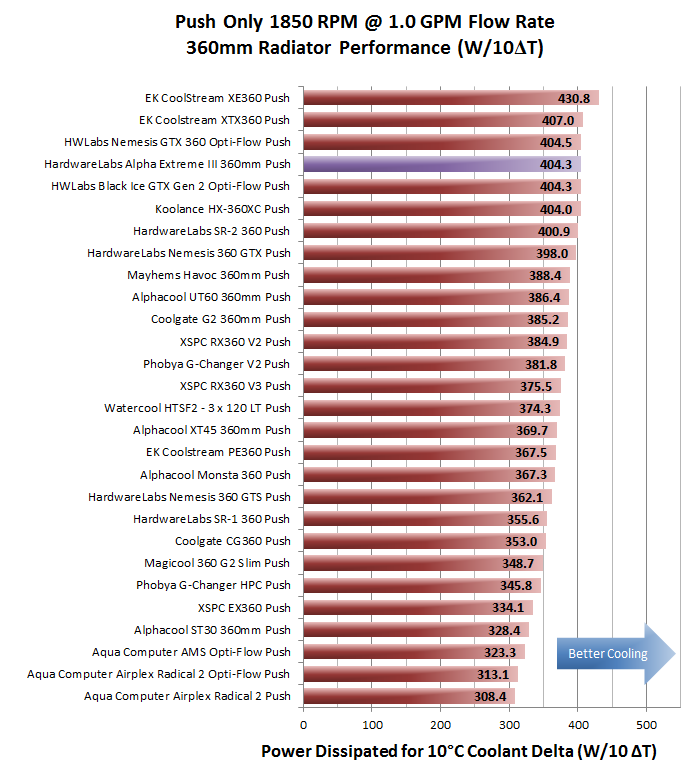
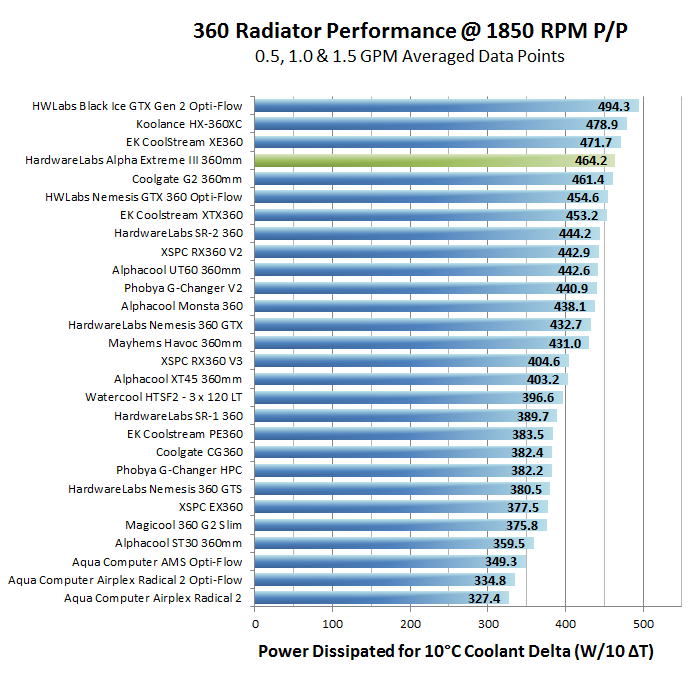
By 1850RPM the alpha is firmly near the top now. Clearly this is a radiator that likes air flow. Presumably Push/Pull will favor it even more:
At 750RPM despite the extra fans it’s still struggling to breath.
At 1300RPM also it’s still only just starting to get going.
At 1850RPM we see it’s best result, but it’s still beaten out by it’s own replacement – the Black Ice Gen 2.
Now it can be quite interesting to take the 1GPM results and compare Push vs Push/Pull. It does get a bit confusing though so make sure to read the legend to identify what the colors mean:
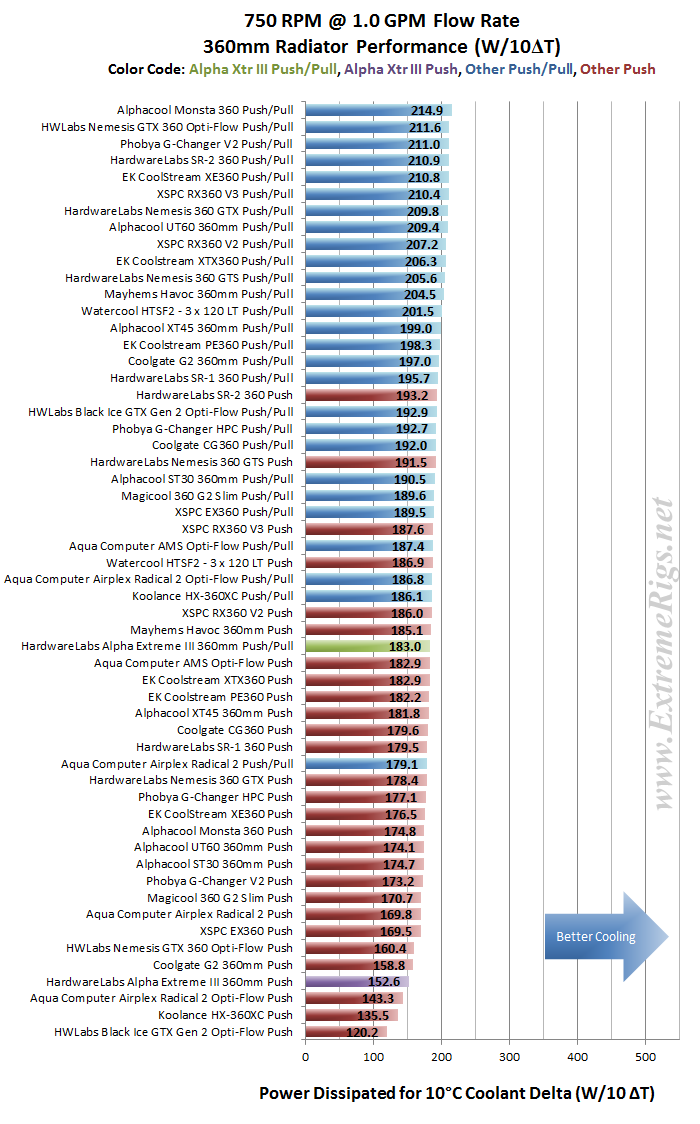
At 750RPM we see that there are several Push only radiator setups that beat the Alpha even when it has three more fans mounted.
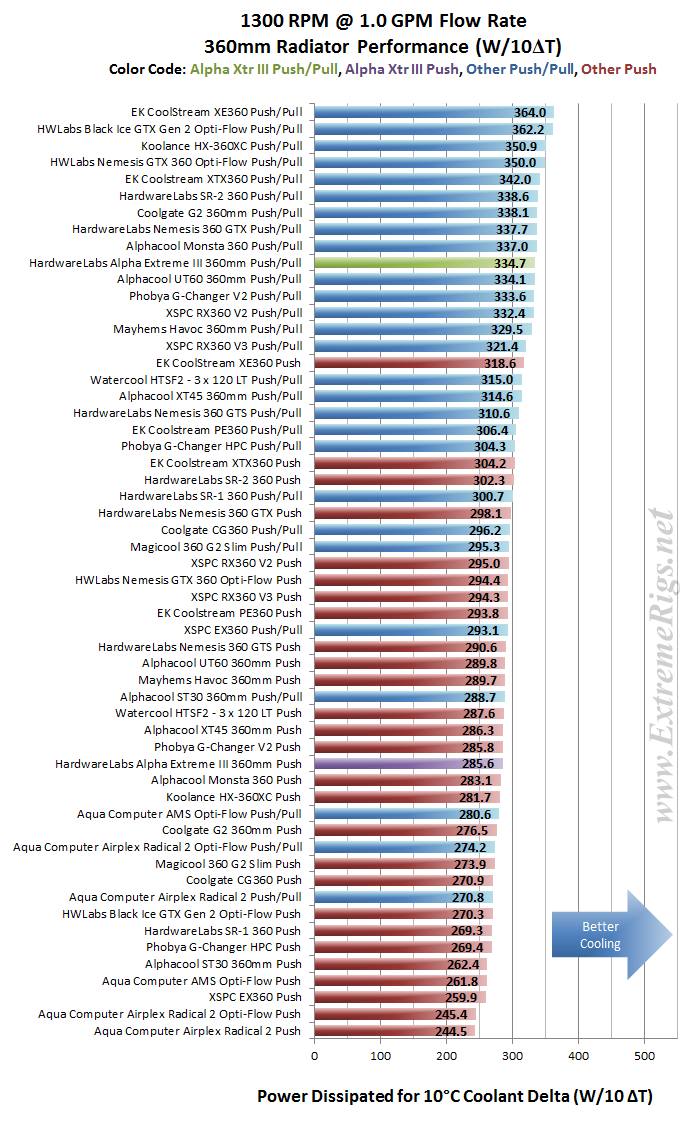
By 1300RPM the push/pull Alpha setup has managed to overtake any Push only setups.
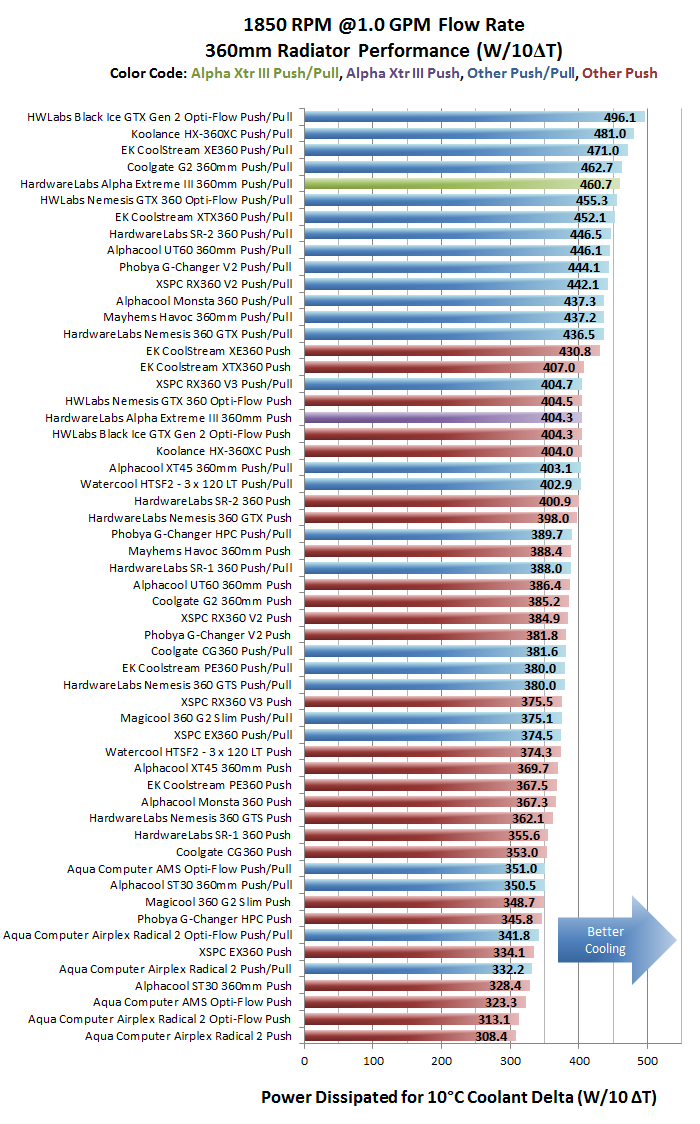
At 1850RPM the Alpha does well with both setups.
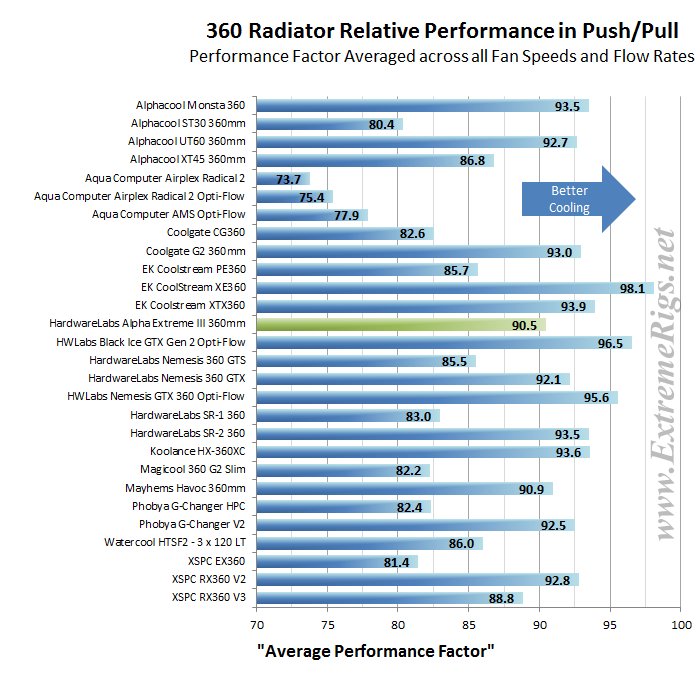
From all of these results we can create a “master performance factor”. The radiator with the best cooling ability (W/10ΔT) at each gpm/rpm combo was awarded a score of 100, and each other radiators W/10ΔT result was scored as percentage of the top performer:
This plot really shows the Xtreme III performing much better in the high fan speed fan tests regardless of the number of fans used. As the fan speeds increase the Xtreme III’s performance increased (comparatively). It seems fair to assume that it may keep increasing in performance with higher air flow too.
Then all these percentage scores were averaged giving us the Averaged Performance Factor of each radiator. This way of looking at the comparison takes away any advantages that a radiator may have at higher or lower fan speeds and looks at an overall average. While this appears fair it does tend to favor those radiators that are all rounders and those radiators which do very well at high RPM. Most users should be more focused on their specific use case. Check in the Round Up for performance comparisons at every gpm/rpm combo for even more details and cross comparison results.
Again let’s start with Push only data:
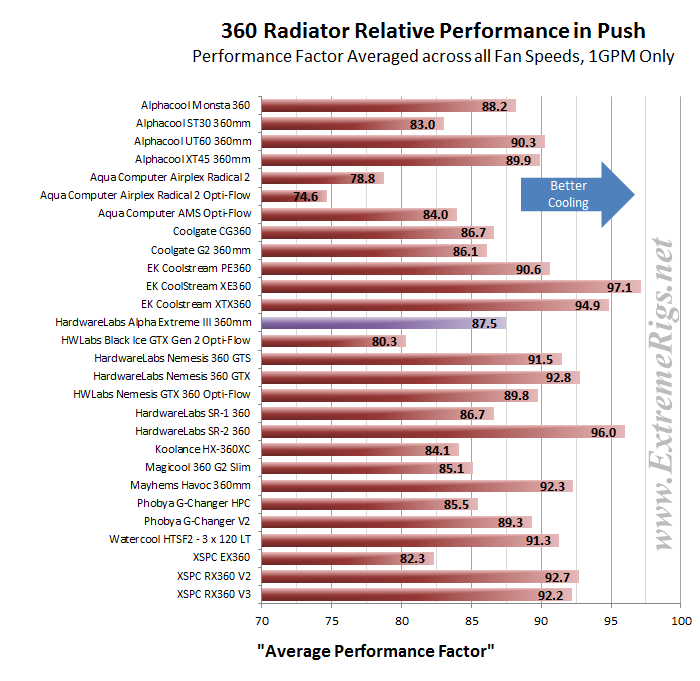
The Alpha looks like it’s in the middle of pack, but this is simply hiding it’s poor low RPM numbers and it’s awesome high RPM performance. This is not an all round performance radiator – it’s a dedicated high speed RPM radiator.
In Push/Pull the result looks similar, albeit slightly improved as you might expect. Again the result hides the truth behind the performance.
Next up – Summary!


[…] HardwareLabs Alpha Xtreme III 360mm Radiator Review […]
Comments are closed.