


Thermal Testing
The Thermal Data
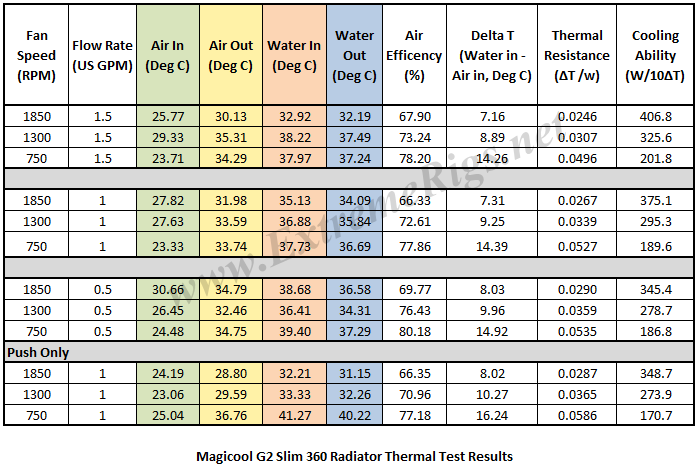
Moving on from the restriction test bench the Slim G2 radiator was loaded into the thermal test chamber for a series of 12 tests – consisting of 3 flow rates, each having 3 different fan rpm rates tested. I felt the thermal test data was most important and which you as the reader would be most interested in.
Below is the final data results gathered from at least 2 data logging runs at each flow rate and fan rpm combination. The most stable 15 minute period from each logging run was used and then averaged with the other runs to obtain the data for the table below. A total of 16 temperature sensors were used in the thermal test chamber (8 air in, 2 air out, 3 water in, 3 water out) each take a reading every second and logged via a CrystalFontz unit. The data in the table below is the result of the logging runs which has then been used to create all the plots and tables there-after.
The performance metric of critical importance is the delta between the warm coolant temperature in and the cold ambient air temperature in to the radiator. Given that the system is well insulated and in equilibrium and we know the heat input to the system then we can also calculate a very important number – that is the amount of power required to raise the coolant temperature 1C (or 10C which is more useful reference point).
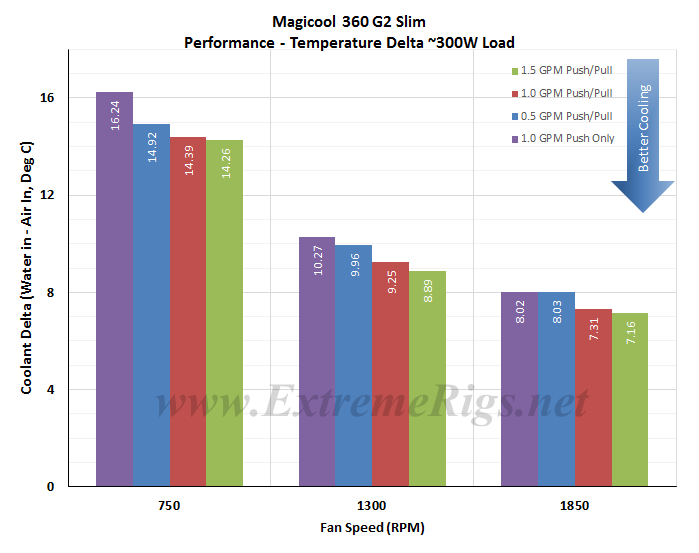
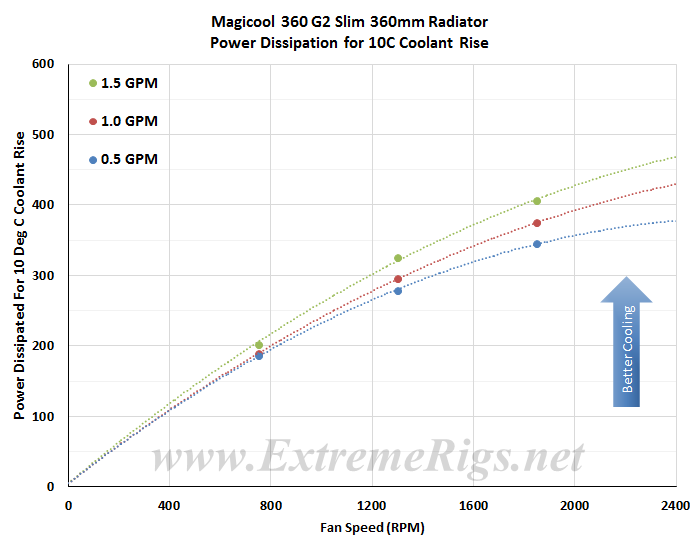
Like the vast majority of the other radiators tested, the G2 Slim cares little about flow rate, particularly above 1.0GPM. Here are some plots to show the variance:
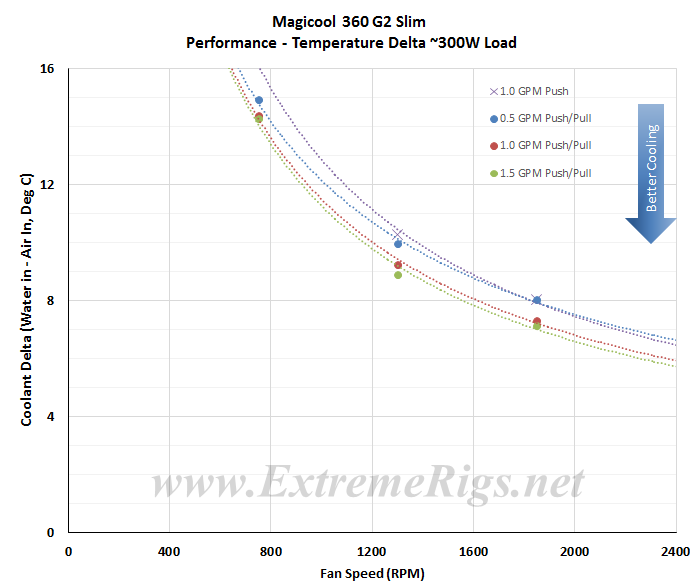
For those who love the curves, I have plotted a chart and added a poly-line to extrapolate the data. Note that the extrapolation of the curve is much more sensitive to error than in between the tested range.
So the performance is not greatly affected by varying flow rate. However Delta T is not always helpful when thinking about how many radiators you would need to cool your system. Instead it’s more useful to know the delta/W, or more usefully, the inverse metric of W/delta C.
The metric plotted below tells us how many watts are dissipated by the radiator when the coolant rises 10C above ambient temperatures. (10 Delta T):
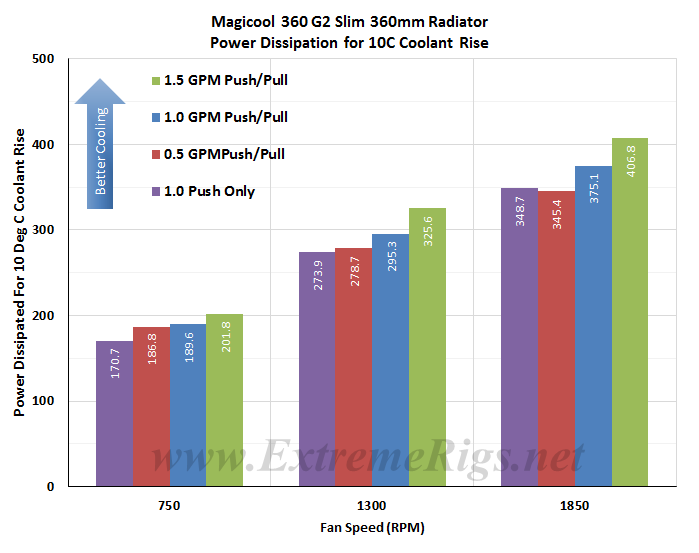
As expected increasing fan speed and therefore airflow through the radiator is the primary determinant in changing the radiators performance. This data can now be plotted as a pretty curve so that an end user can interpolate their own fan speed. Note again that the extrapolation of the curve is much more sensitive to error than in between the tested range.
This makes it easier to see that at higher fan speeds that a low flow starts to impact the cooling performance. This makes sense if you take it to the extreme and think about a very low flow rate where the coolant is already cooled 99% of the way to ambient with 10% of its journey through the radiator. In this example the radiator is not being efficiently used. 90% of the radiator surface area would then be wasted and you could have used a smaller radiator.
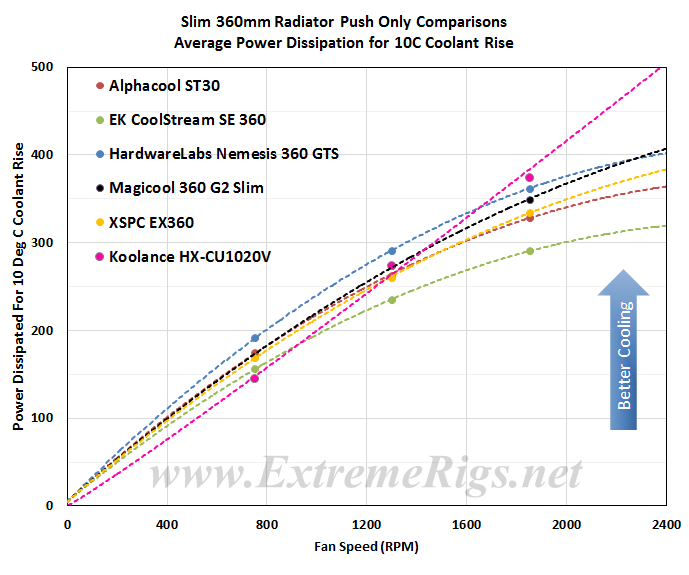
In this next chart all three Push Only results at 1.0 GPM flow rate were plotted to produce one curve and we compared the results against the other slim rads Push Only results.
Now let’s compare Push vs Push/Pull:
For the Push/Pull comparison chart we have averaged the 3 fan speed test results at each flow rate to produce the curves. Averaging reduces test error of course so this helps further to be sure of our data and is more useful therefore for comparing to other radiators.
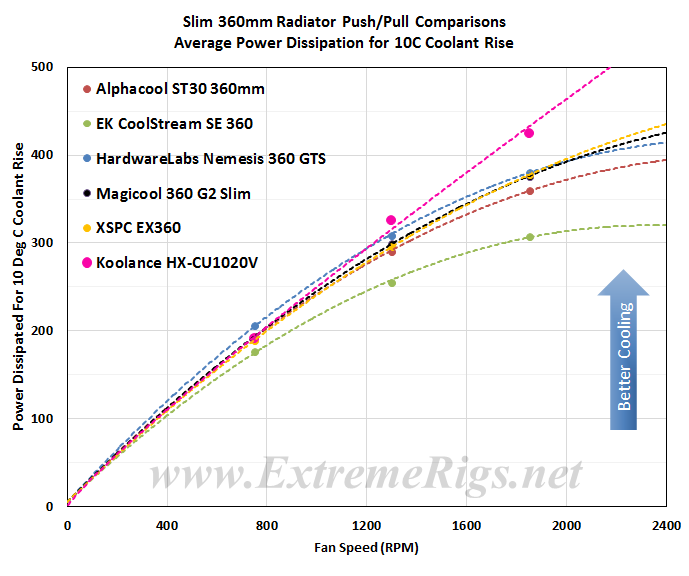
The G2 Slim appears to be right amongst the action in both charts, but it’s a bit hard to distinguish the results, so…..
Now let’s analyze that data some more.


[…] Hardware Labs SR-1 360 Radiator Hardware Labs SR2 360 Radiator Koolance HX-360XC 360 Radiator Magicool G2 Slim 360 Radiator Mayhem’s Havoc 360 Radiator Phobya G-Changer HPC 360 Radiator Phobya G-Changer V2 Full Copper […]
Comments are closed.