


The Thermal Data
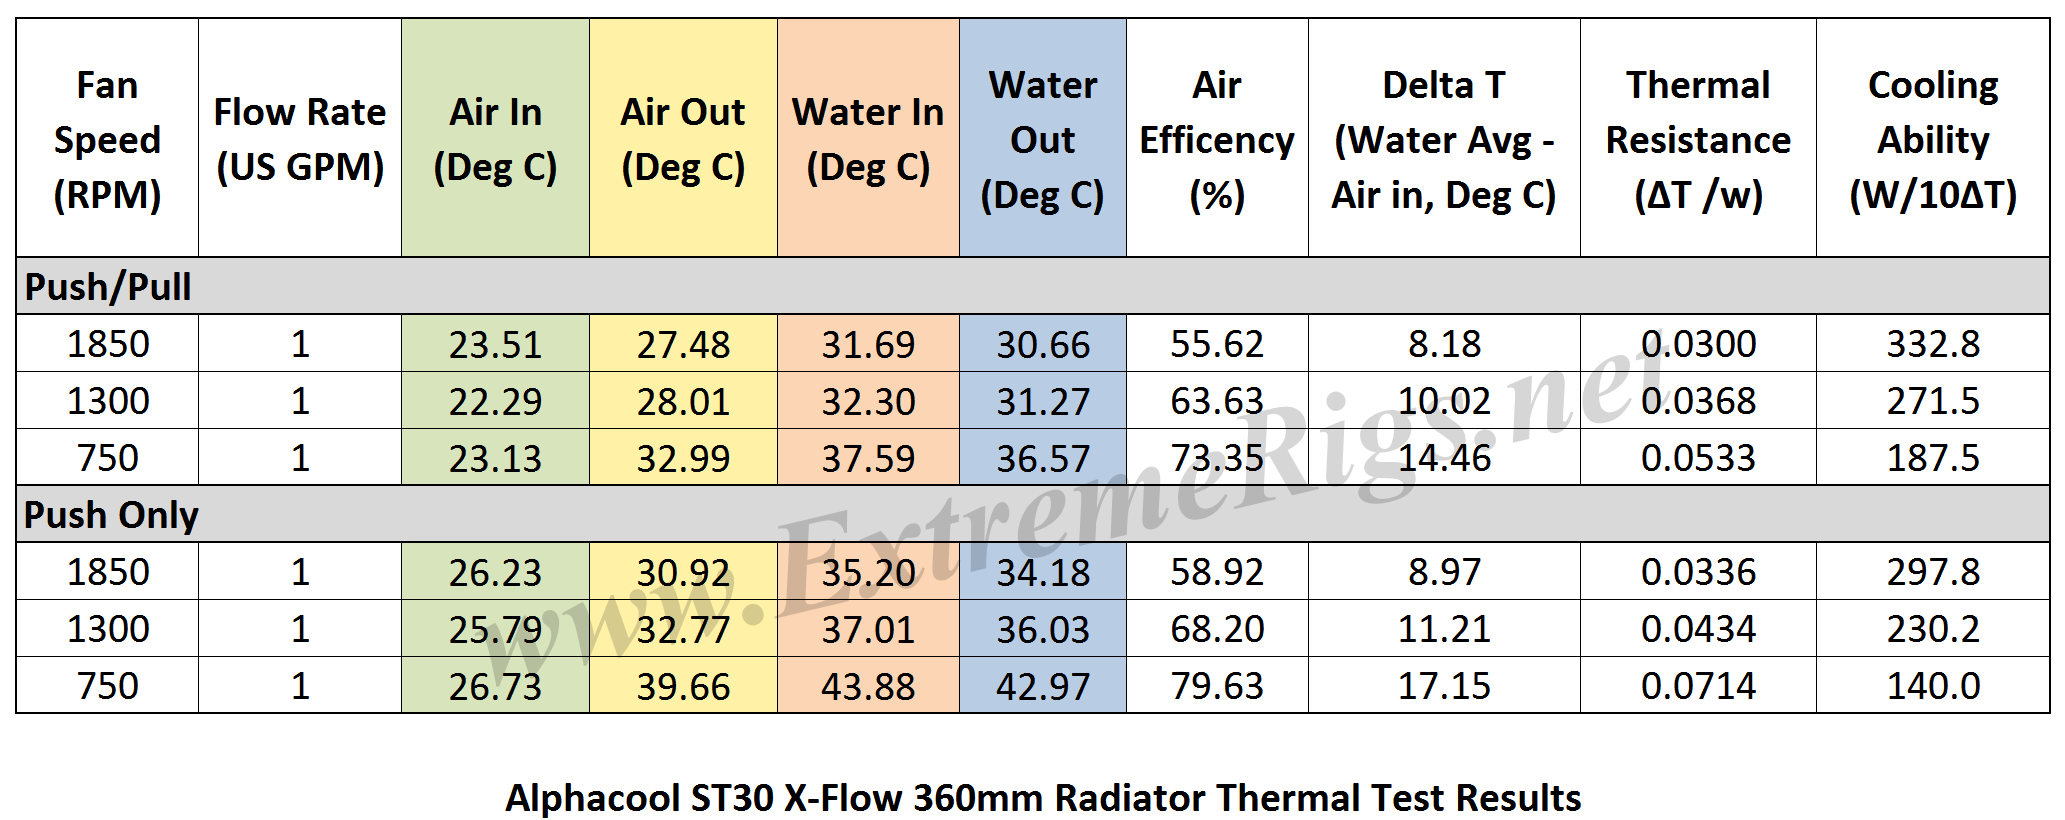
Moving on from the restriction bench the ST30 X-Flow was loaded into the thermal chamber for a series of 6 tests conducted at 1.0 GPM with Push/Pull fans and Push Only, each having 3 different fan rpm speeds tested.
Below is the final data results gathered from at least 5 data logging runs at each fan rpm. The most stable 15 minute period from each logging run was used and then averaged with the other runs to obtain the data for the table below. A total of 16 temperature sensors were used in the thermal test chamber (8 air in, 2 air out, 3 water in, 3 water out). Each sensor takes a reading every second and logged via a CrystalFontz unit. The data in the table below is the averaged results of the logging runs which has then been used to create all the plots and tables there-after.
NOTE: Since our massive Radiator Round Up was completed, the thermal testing rig was retired and parts pulled from it for use in other projects. However, the rig was recommissioned for this review and one other, but after several days testing we were unable to get the same calibration on the rig as in the past. Therefore we are not able to compare (apples to apples) these recent results with data previously recorded. Because of this we re-tested a couple of radiators with the new calibration so that we do have some results to compare the ST30 X-flow against. As we were changing the testing comparison we decided to reduce the large number of hours spent data logging by focusing solely on 1GPM flow rates. This would streamline the extensive testing process by about 50%.
 A performance metric of critical importance is the delta between the warm coolant temperature and the cool ambient air temperature going into the radiator. Given that the system is well insulated, in equilibrium and we know the heat input to the system then we can also calculate some other very important numbers. The most useful for the end user is the amount of power being dissipating from the coolant during it’s pass through the radiator. That amount is what we refer to as Cooling Ability and is typically displayed with 1°C or 10°C Delta T as a reference point. The latter being more useful and is a good target for users to aim for when testing their loop. This W/10DT or W/10ΔT is the calculation used for our thermal performance assessments and comparisons.
Let’s take a look at the Delta T results from the tests, firstly plotted with extrapolation and followed by a bar chart. Note that the extrapolation of the curve is much more sensitive to error than in the tested range. With the omitted flow rate testing what we have here is essentially a DeltaT comparison of Push Only Vs. Push/Pull at 1.0 GPM.
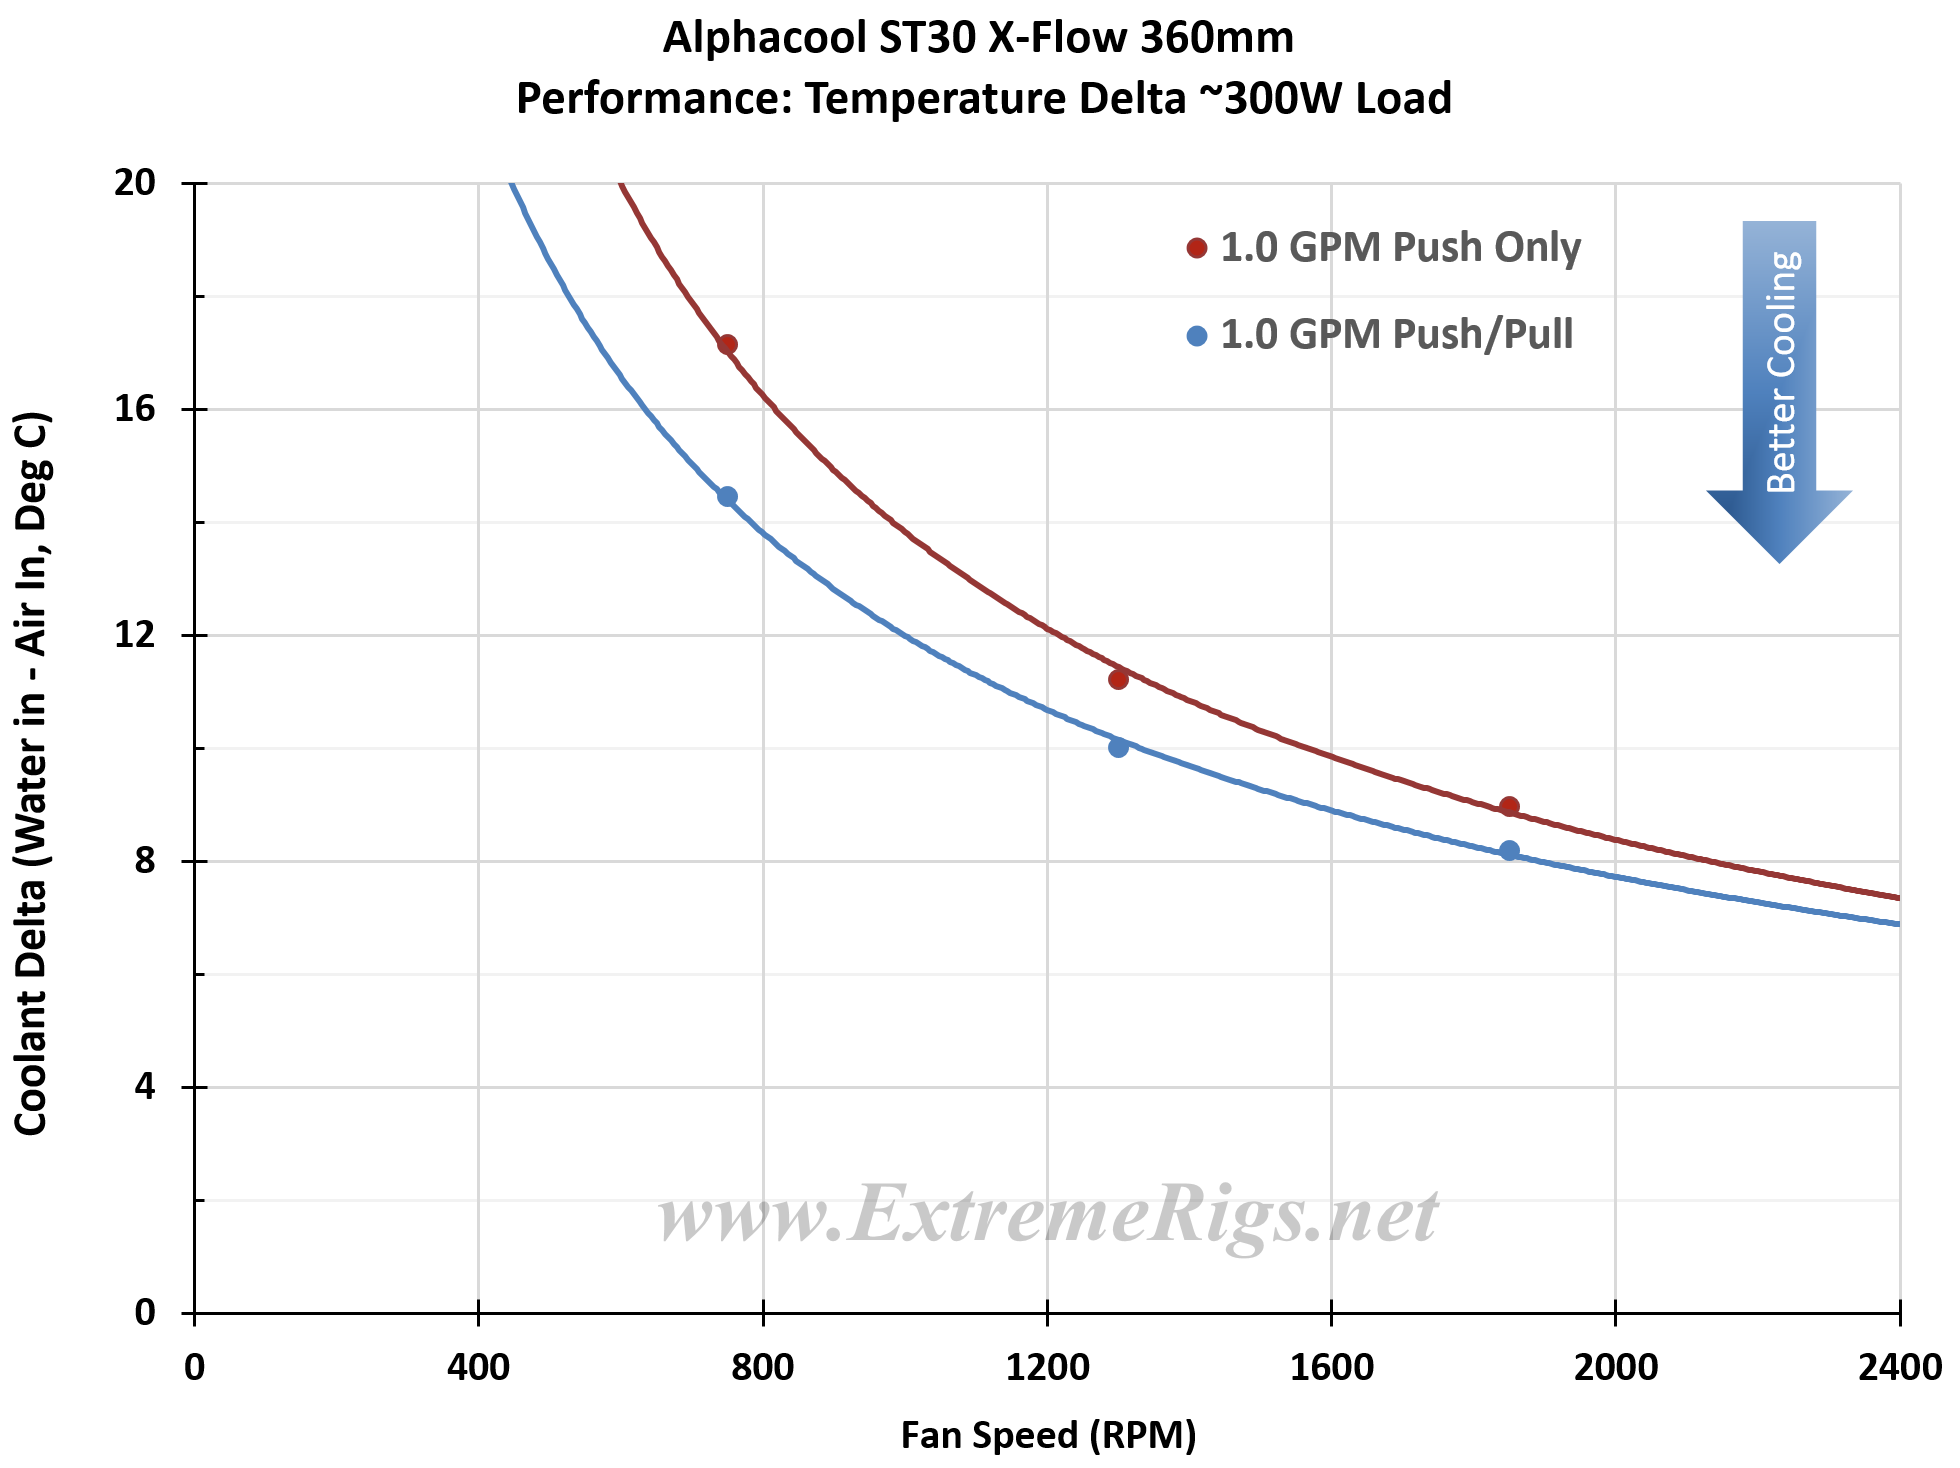
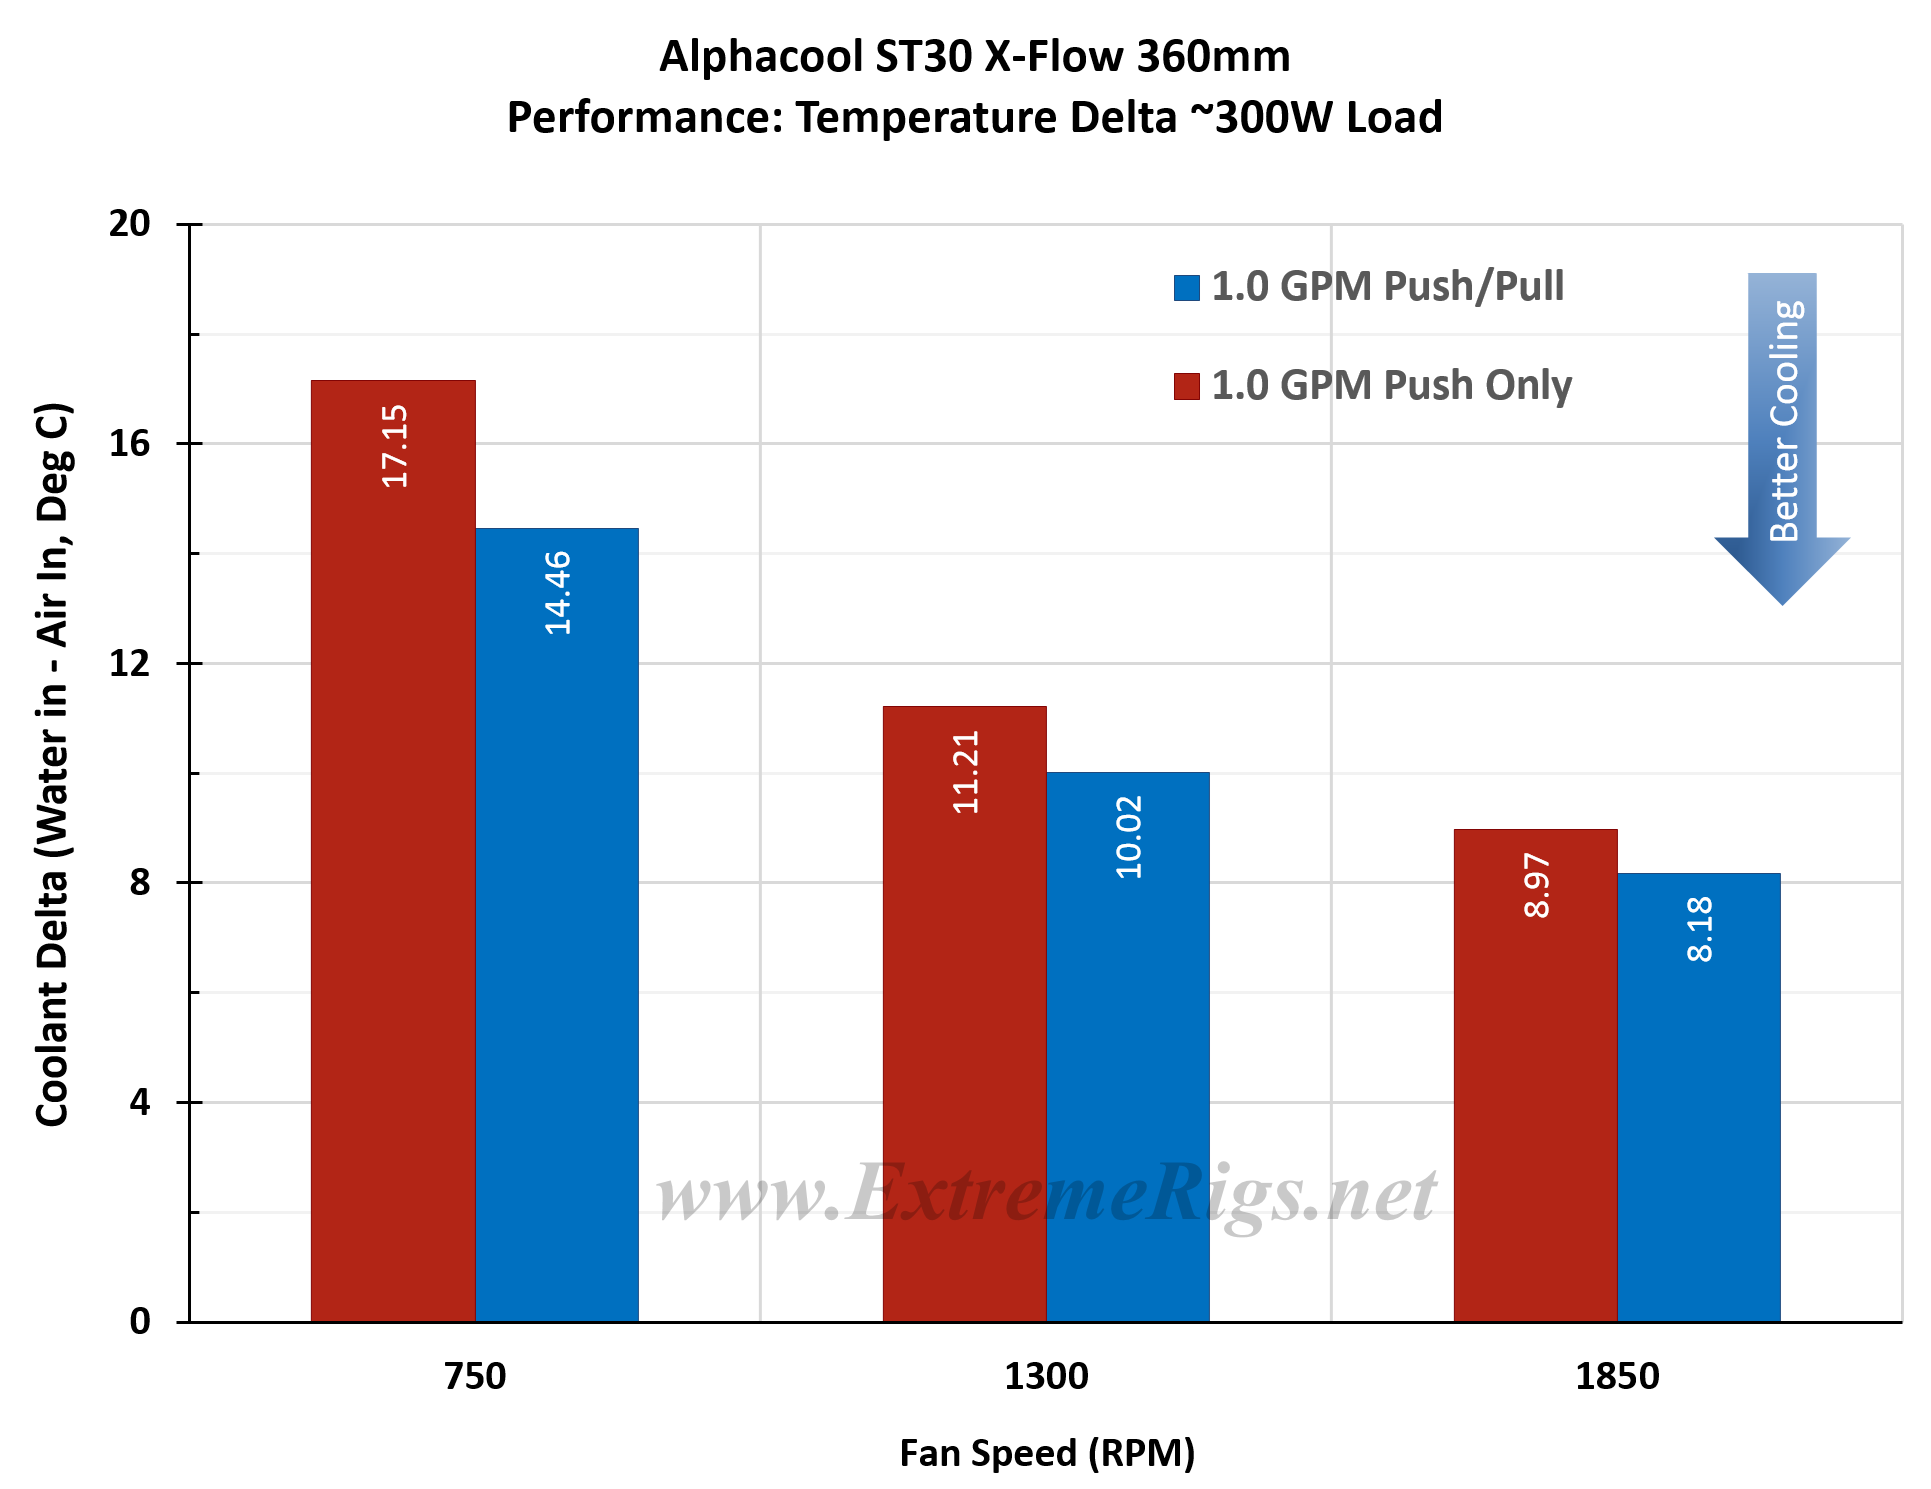 I was not too concerned about the actual delta number results, but instead the trend pattern. As expected the deltas come down significantly as the fan speed is increased.
Delta T results (as above) are not always helpful when thinking about how many radiators you would need to cool your system. Instead it’s more useful to know the metric of W/Delta C. This metric is plotted below. It tells us how many Watts are dissipated by the radiator when the coolant rises 10C above ambient temperatures (W/10ΔT).
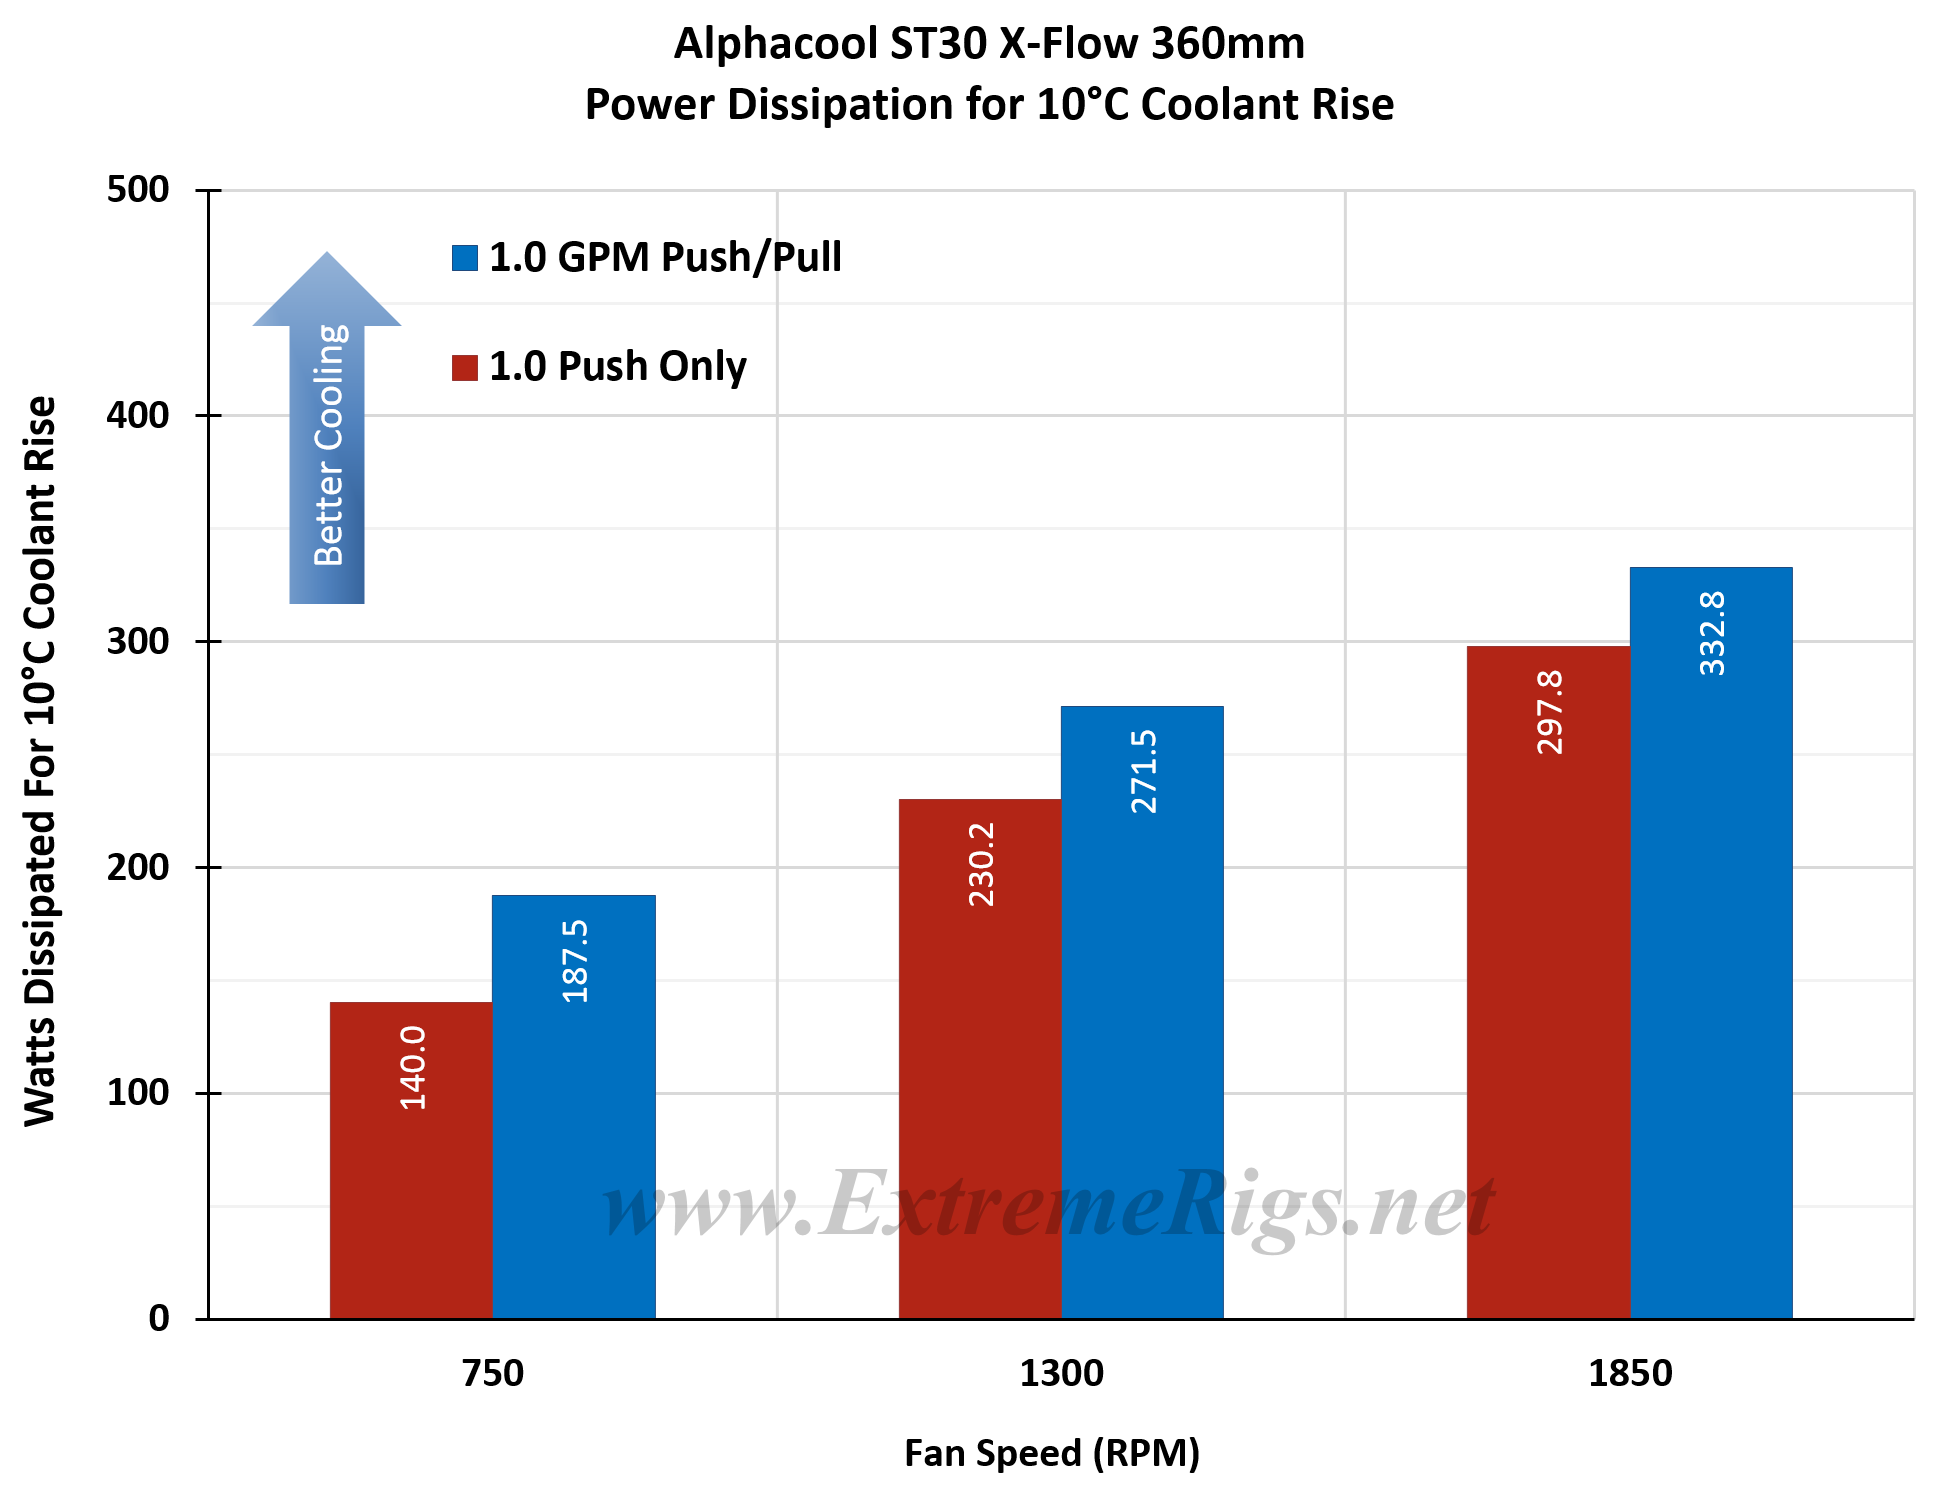
This same data can now be plotted on a chart so that an end user can interpolate their own fan speed. Note again that the extrapolation of the curve is much more sensitive to error than in between the tested range.
As the sampling was reduced to only 1.0 GPM we don’t have the different flow rate comparisons in Push/Pull, but we do have the data to compare the Push Only Vs. Push/Pull in an “apples to apples” fashion by only looking solely at the 1.0 GPM data:
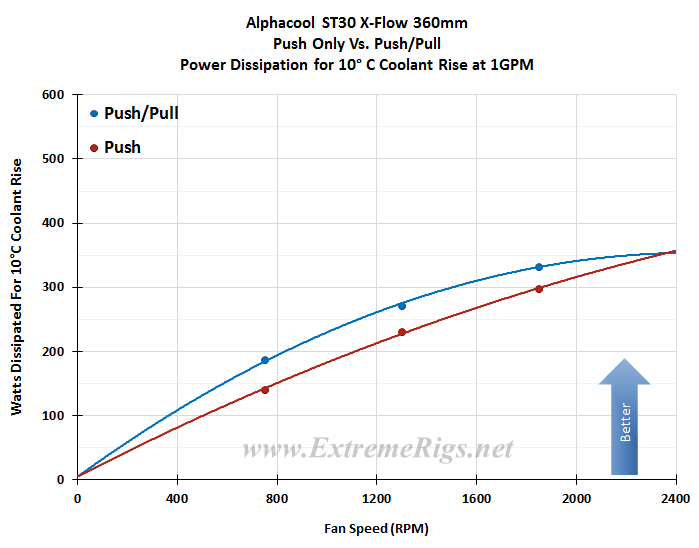 The average difference between Push Only and Push/Pull results at the same fan speed was ~11%, and ranged from ~8% at 1850 rpm to ~14% at 750 rpm. These are decent percentage increases for a slim radiator, though the end result is probably not great enough to recommend Push/Pull for this or any other slim 360mm radiator.
Of interest with the extrapolated curves in the above chart is that the Push/Pull curve has all but flattened out by 2400 RPM indicating it’s peak performance has almost been reached. On the other hand Push Only would (in theory) continue to improve if the fan speed (air volume and pressure) could be increased.
Let’s analyze that data some more…
![]()


Are there some thicker cross flow radiator on the market?
Alphacool also have x-flow versions of their other radiators such as the XT45 and UT60. If you want thickest I think the UT60 is the only choice out there 🙂
Is this the best cooling 30mm rad on the market? Thanks!
In general the Black Ice Nemesis GTS generally seems to perform the best out of any slim radiators though the tradeoff is that it’s very high restriction.
Does that cancel out their overall performance though (which seems excellent)? I would have thought for the vast majority loops the Nemesis GTS would still be the best choice when seeking a low RPM rad solution?
Not usually in my opinion, but if you are going to run a bunch in series with a weak pump, then yes it may.
In the 360mm size?
Comments are closed.