


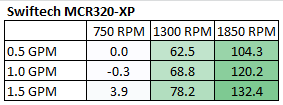
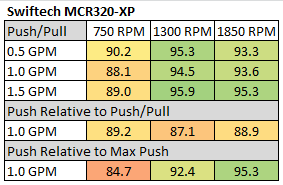
This first table shows the MCR320-XP’s W/10ΔT numbers in a quick glance chart format.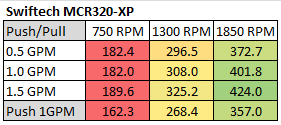
How does the 0.5 GPM result beat the 1.0 GPM – well it can’t, at least not under the laws of fluid dynamics we are aware of. Instead the reason we offer is simply test margin error.
We have striven from the beginning of our radiator testing to achieve a test error margin of 1% or less. We ran tests for months to verify data was accurate and repeatable before we commenced testing to publish the results. With our test equipment and methodology we believe we produce the most accurate data available for radiator thermal dissipation.
However, when results are as close as those as we see in the 750 RPM column for 0.5 and 1.0 GPM we simply have to admit that 0.22% difference is not enough difference for us to say which is better. We invite you to calculate a worst case (test error margin) scenario for the above results by subtracting 1% from the 0.5 GPM result and adding 1% to the 1.0 GPM results. ~3.5 Watts can make a lot of difference in rankings and we are aware of this. Please rest assured our results are as accurate as possible and we conduct our tests with the utmost of diligence with the excellent equipment we have. Most times we blissfully ignore our test error margin, knowing it’s the best we can do. BUT when a discrepancy such as the above shows up, we feel obliged to offer a decent explanation,
Using this data we can effectively show percentage gains/losses relative to a reference point. It’s an interesting way to show gains/losses while changing a variable.
The following table uses 1300 RPM as our reference to see how much gain or loss in performance we get by changing fan speed up and down.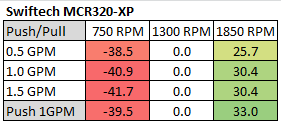 The differences in both the drop to 750 RPM and the jump to 1850 RPM were on average the 2nd largest of the slim radiators and in line with what we would expect see on a radiator with a medium to high fin count.
In our Tuning Table for Flow Rate Variance with 1.0 GPM as a reference point, we again see little variance between results when changing flow rates at the same fan speed.
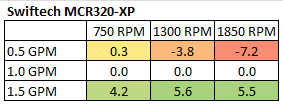
The next three tables have specific reference points set for gain and loss comparison.
1.0 GPM @ 1300 RPM reference point.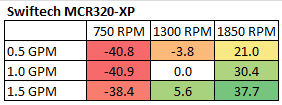
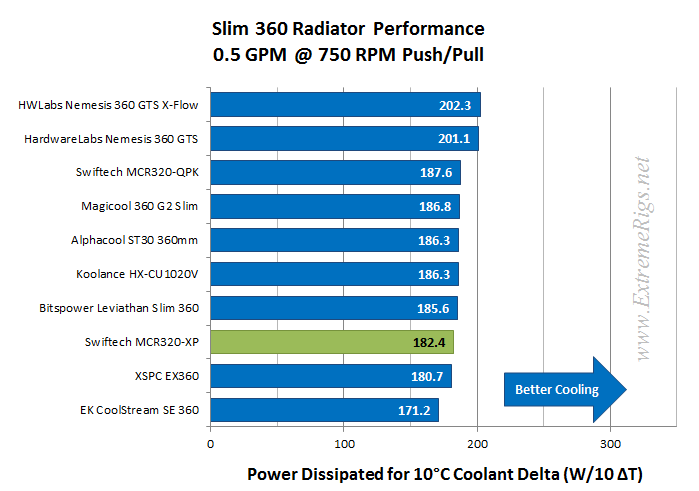
0.5 GPM @ 750 RPM reference point.
1.5 GPM @ 1850 RPM reference point.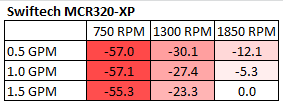
So from the data above we’re getting a good idea of how the MCR320-XP radiator performs relative to itself. But there is a large selection of 360mm radiator models to choose from, so let’s put the MCR320-XP’s results into some comparison charts.
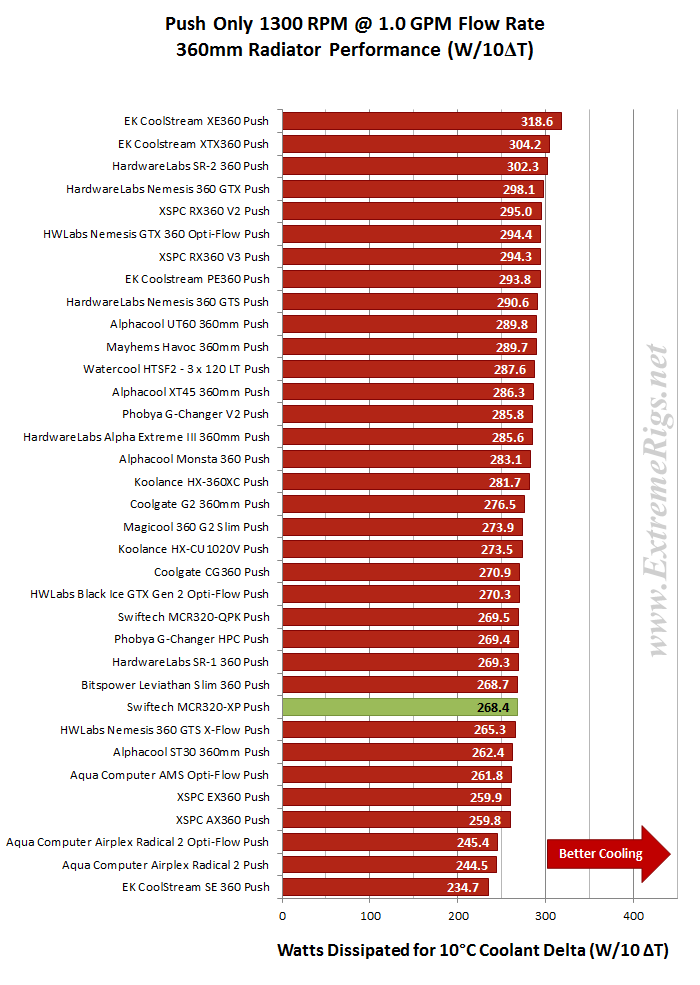
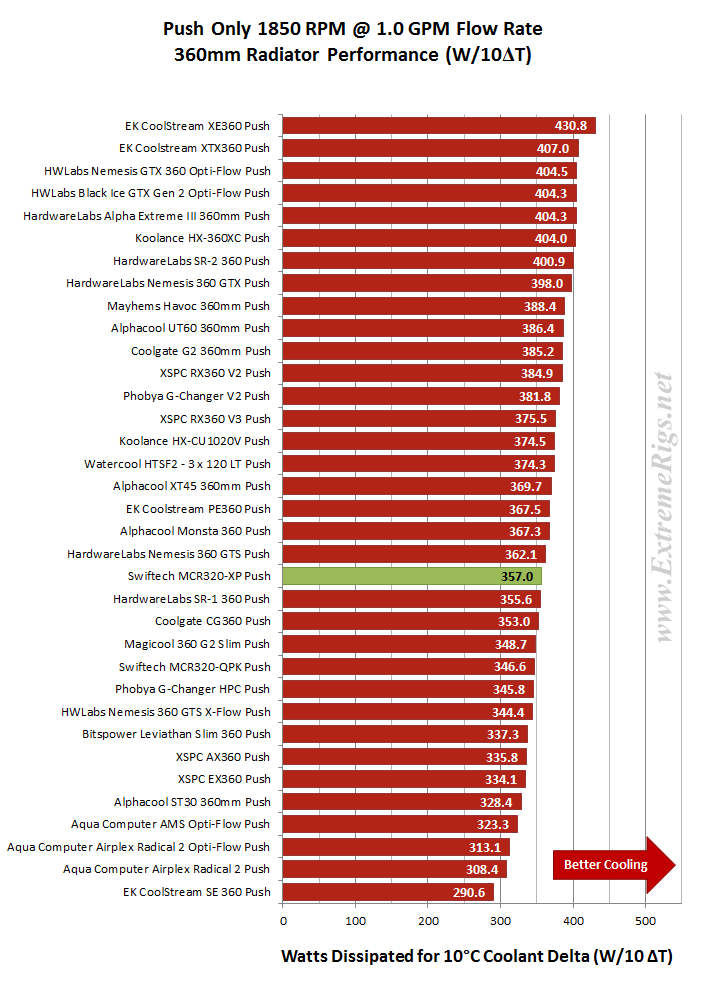
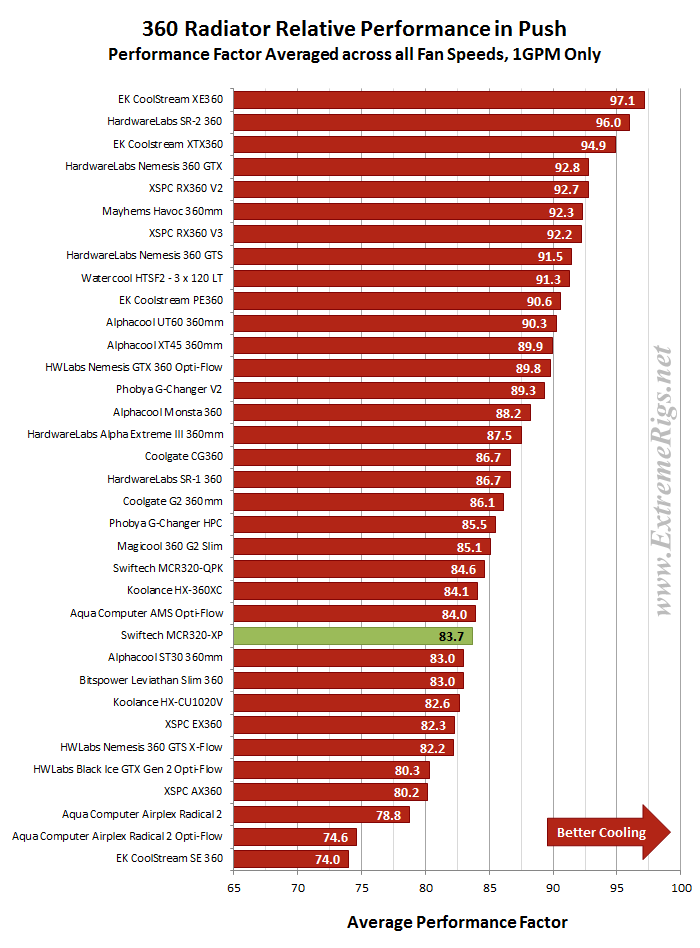
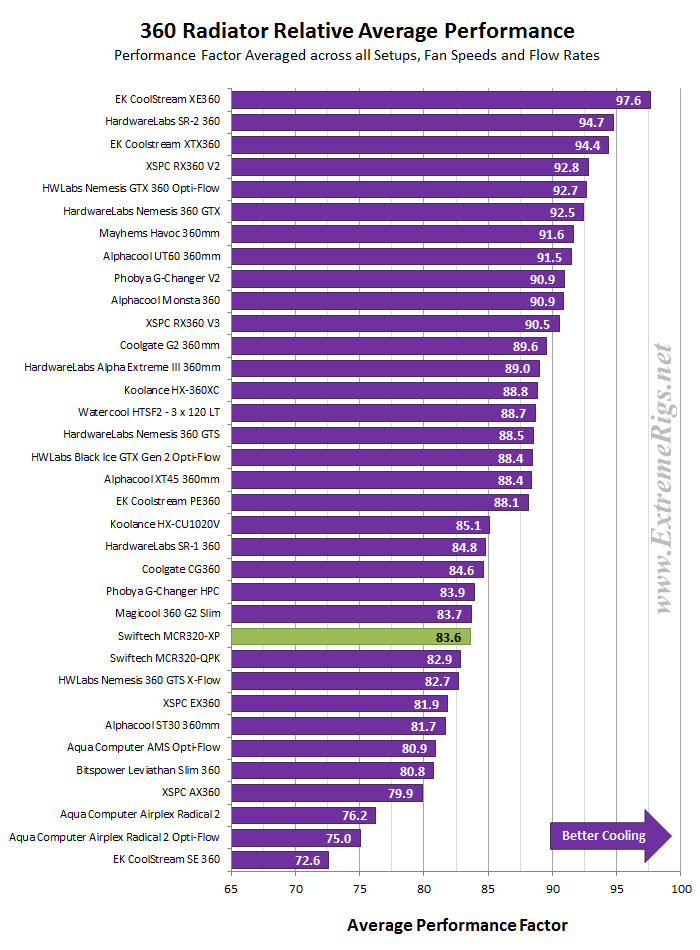
As with our previous Slim 360mm radiator reviews, we’ll only comment and score on comparisons made against other Slim 360s. For those interested we’ll also make available the data against all the 360mm models, but they will be spoilered and not commented on.
There is a LOT of data which make up our charts and previously we have not published all of it. After receiving requests for certain data to be included we’ve decided to now include even more plots. Aware that we are at data saturation point and are at risk of the page becoming information overkill – we’ll try to keep things somewhat simplified by applying spoilers on some plots from now on. All the data will still be available, just means a few extra click for those who wish to analyze everything.
Push Only Data vs Competition
Focusing on the Push Only results for now, we’ll get to the Push/Pull data later.
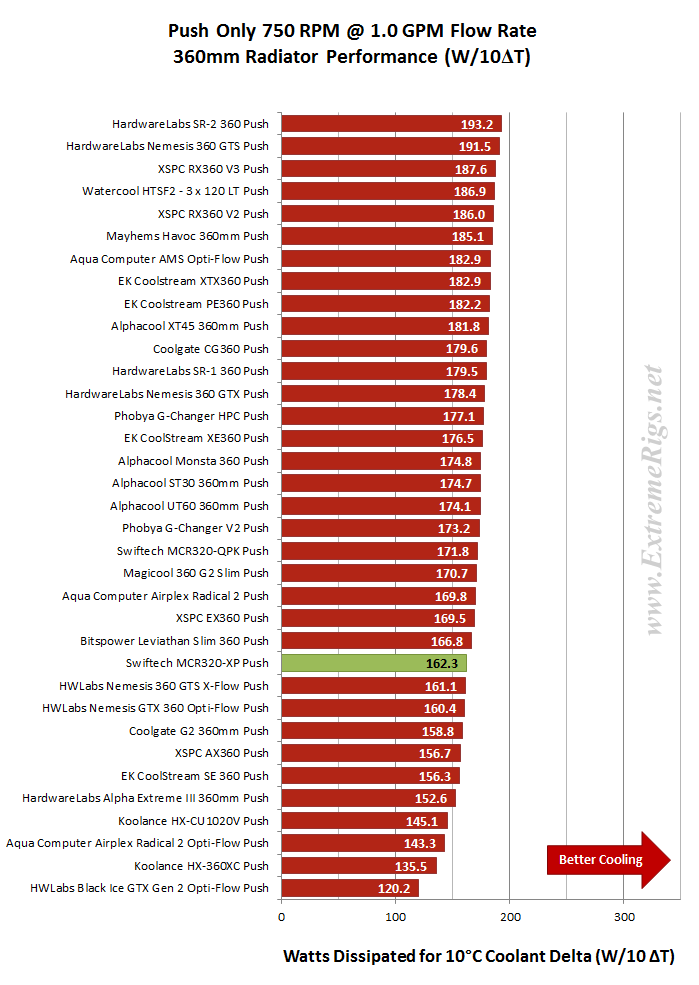
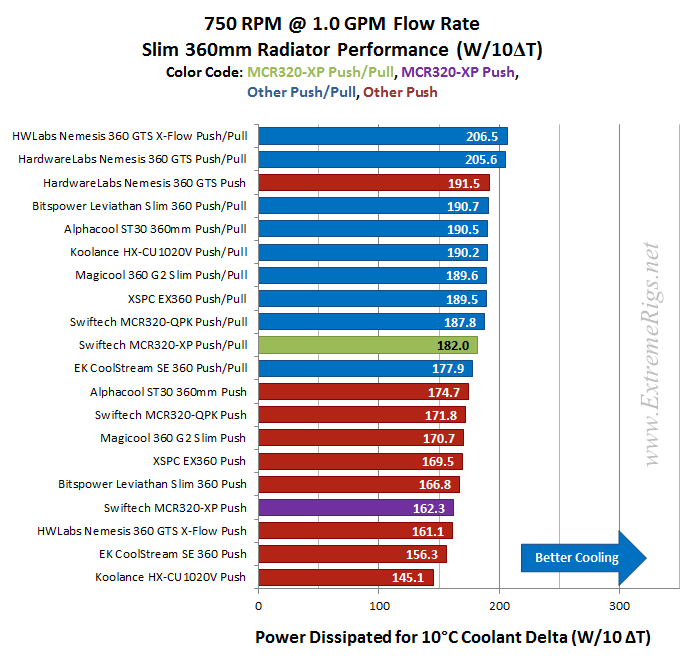
Let’s start with 750 RPM and see how the MCR320-XP compares.
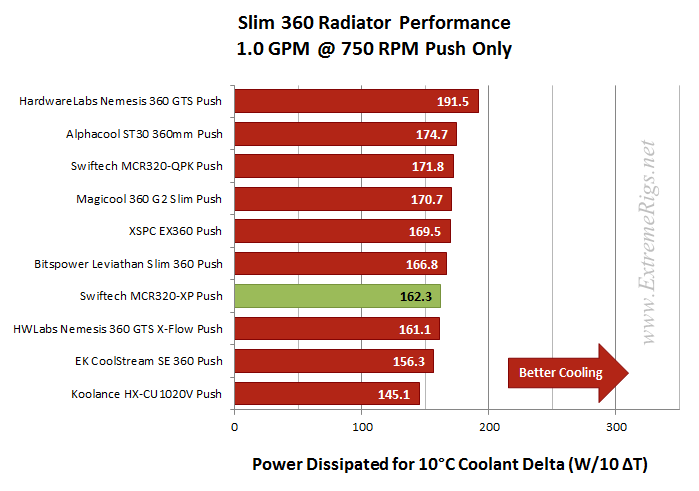 The MCR320-XP finished in the lower half of the pack for Push Only at 750 RPM. The clear winner was ~15% ahead at this data point. The MCR320-XP was not expected to have outstanding performance at this data point due to it being tuned for better performance with medium to high-speed fans. It’s result was not a total write-off however and was only 7% behind the second place radiator.
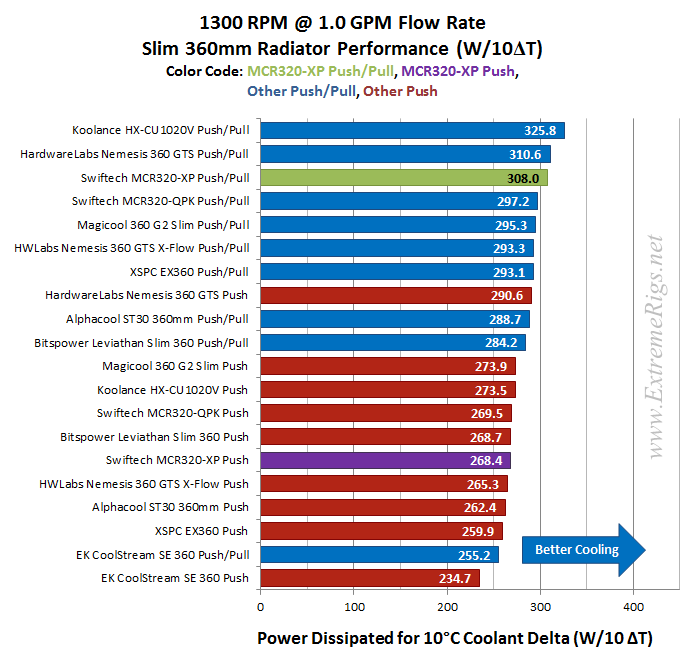
Now let’s look at 1300 rpm:
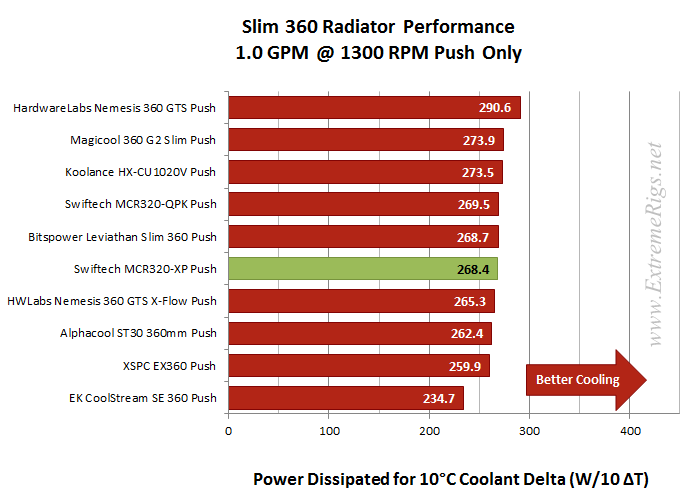 For Push Only 1300 the middle of the ranking table has tightly grouped results and the MCR320-XP lands right in the middle. Of interest is that the other Swiftech model which is tuned for low to medium speed fan assemblies is still ahead of the XP, although the margin it is ahead by is very small (0.4%) and within our test error margin, so technically this would need to be called a draw.
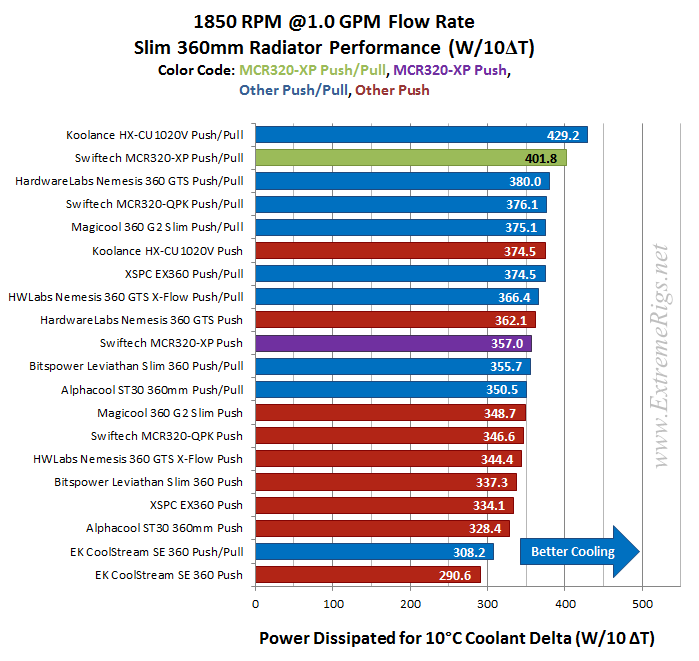
Now 1850 rpm Push Only:
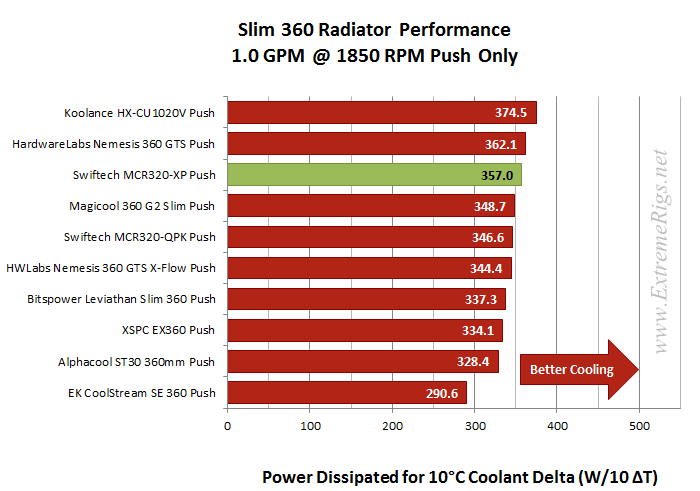 At 1850 rpm the MCR320-XP seems to have found it’s sweet spot. It is now clearly ahead of it’s stablemate. This is the data point that the XP was designed for and it didn’t disappoint.
While not a stand out performer In Push Only, the MCR320-XP did produce a solid enough data set. It had results that were competitive with the majority of the field with both low and medium speed fans. Thermal dissipation boosted when we ran the high-speed fans and a 3rd place finish was achieved.
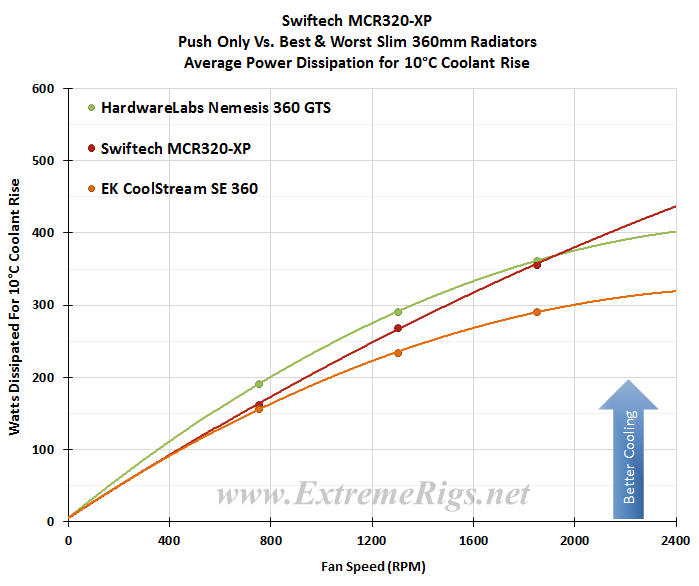
One more chart to share for Push Only. Here we have plotted the MCR320-QPK against the best and worst performing slim 360mm radiators in Push Only.
Now let’s find out how the MCR320-XP performs with Push/Pull fans.
Push/Pull is possibly the most unlikely installation scenario for the MCR320-XP. It’s a set-up which we would not recommend using for any Slim radiator. The benefits of Push/Pull on a slim rad aren’t great enough to warrant the extra space required. If you have 80mm of space available (slim rad + 2 fans) we would advise investigating a thicker radiator with a Push Only fan assembly.
Push/Pull Data vs. Competition
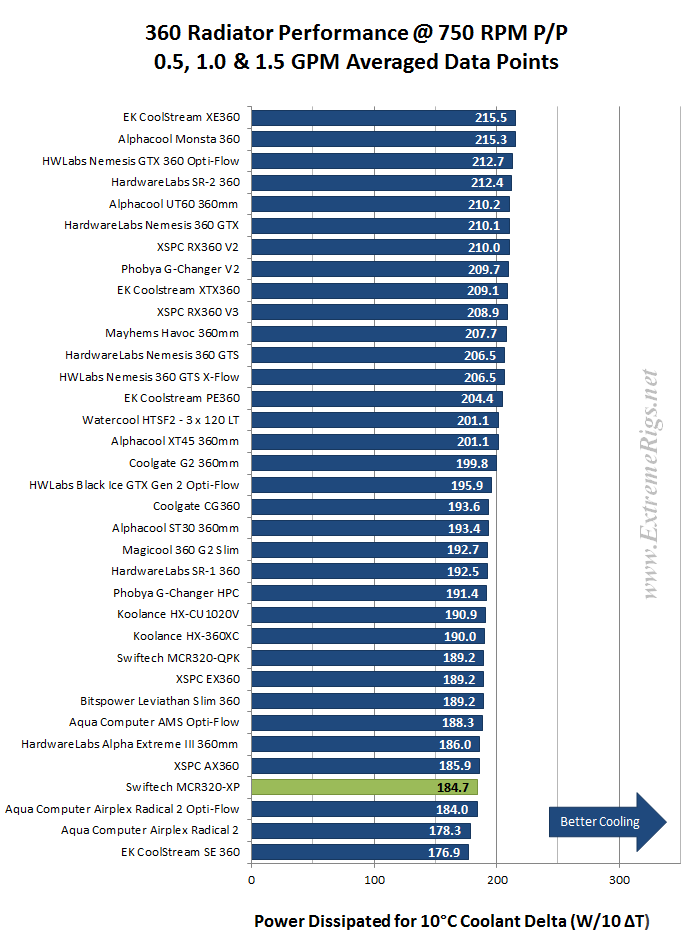
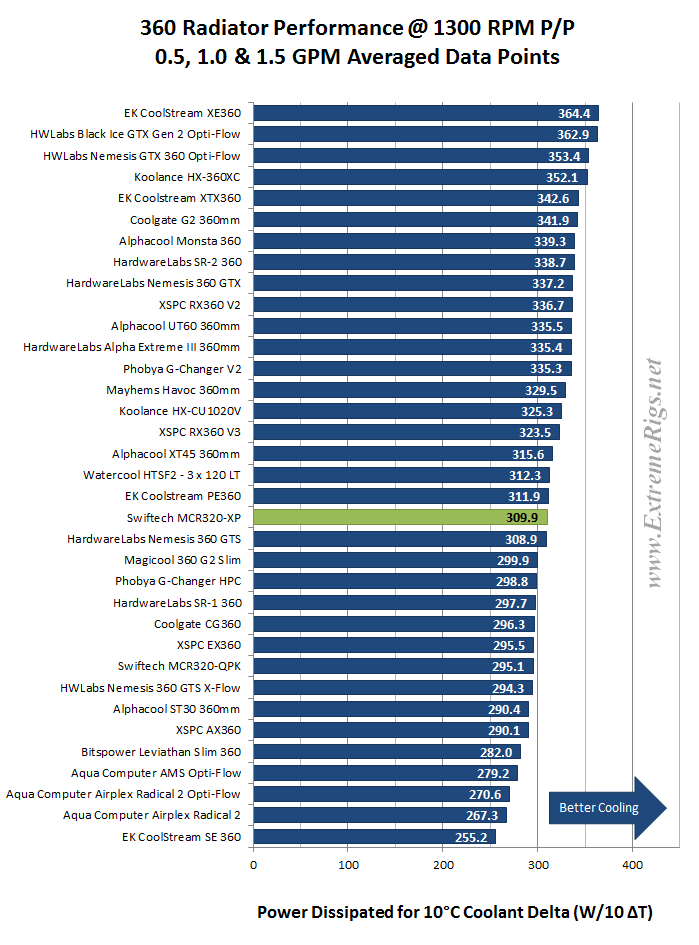
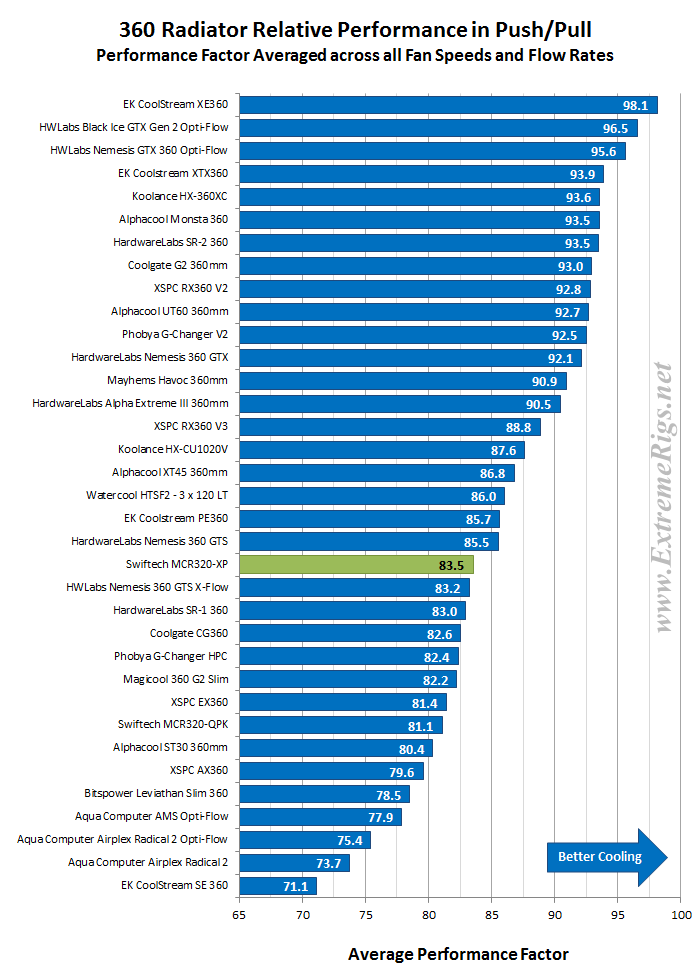
For Push/Pull comparisons we display the plot and comment on the averaged results at each fan speed for the Slim 360mm radiators only. Individual ranking plots for each flow rate / fan speed are spoilered, as are averaged results against all 360mm radiators.
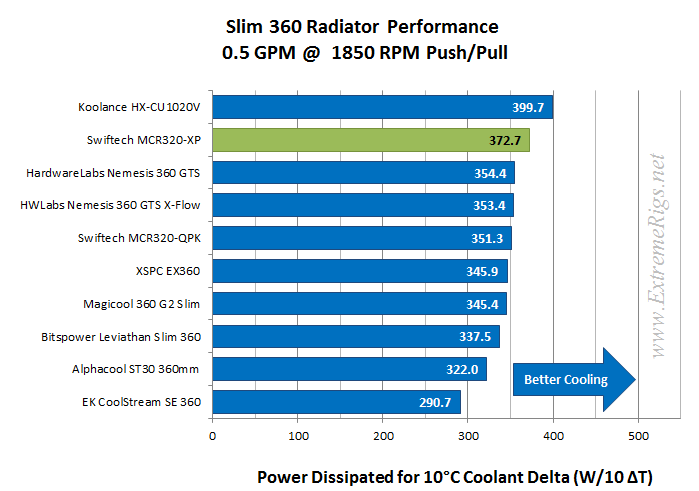
Firstly the 750 rpm:
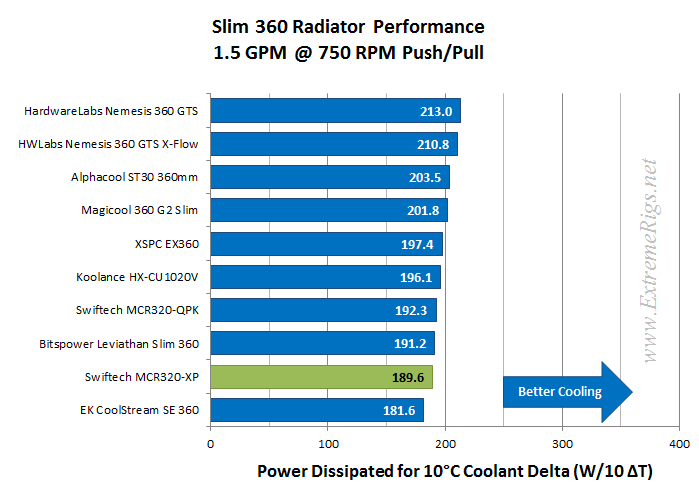
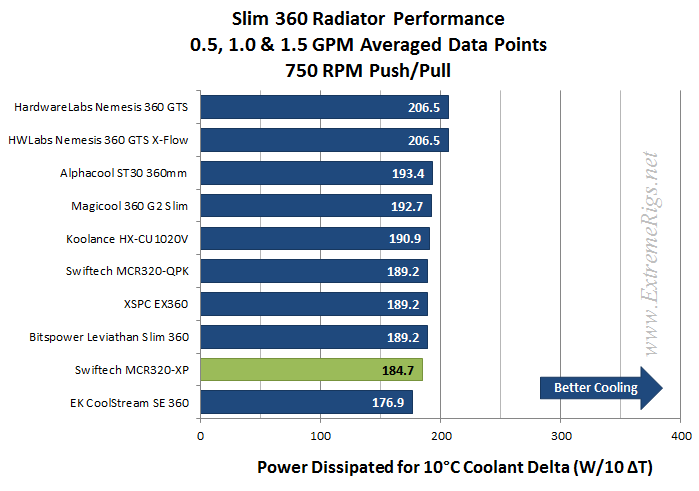 The MCR320-XP lands in 2nd last position with a low-speed Push/Pull fan assembly. There were two clear winners while the rest including the MCR320-XP had very close results. The difference between 3rd and the MCR320-XP for the averaged Push/Pull results was only 4.5%.
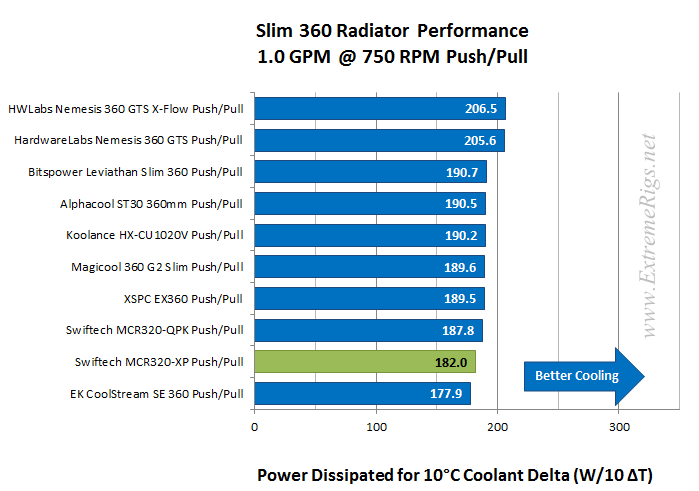
Let’s move to 1300 rpm:
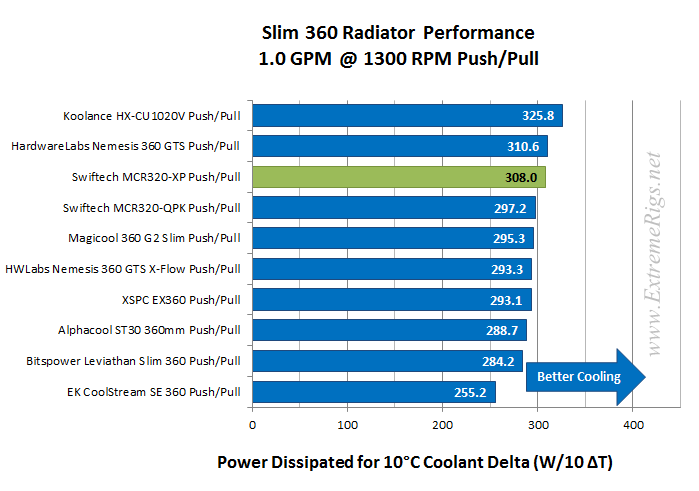
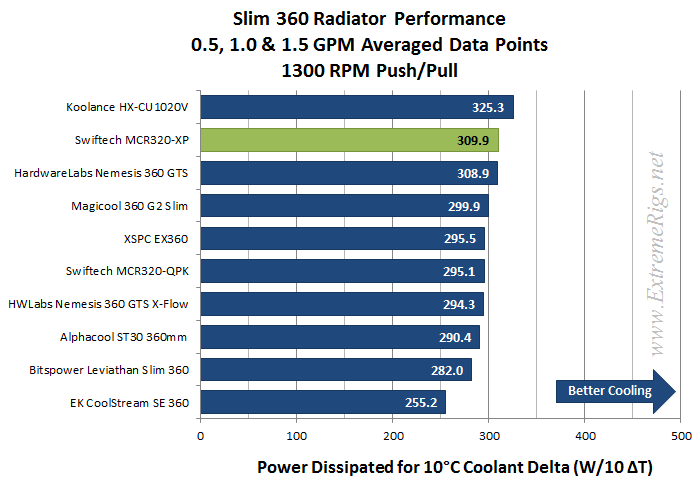 At 1300 rpm the MCR320-XP jumps up the ranking table to take 2nd place. It’s a great test result, but a shame that not many users will benefit from it in the real world. At 16 FPI is has nearly half the fin surface area of the 30 FPI split fin Koolance radiator which took 1st place.
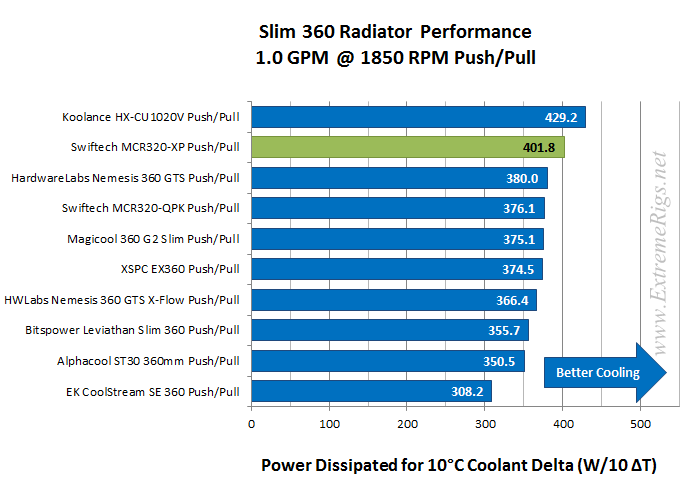
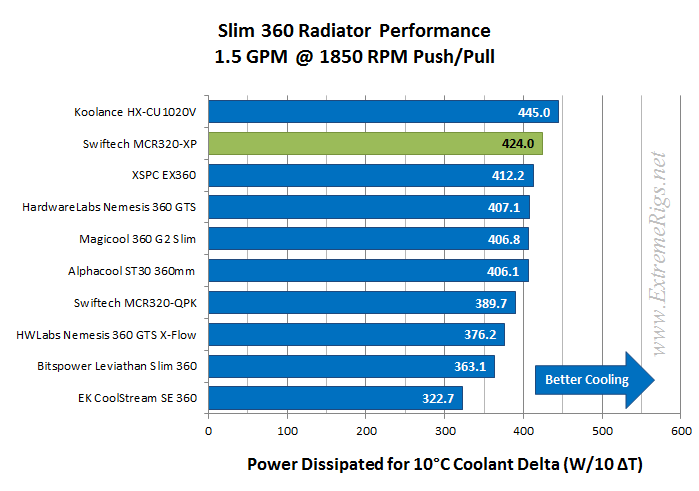
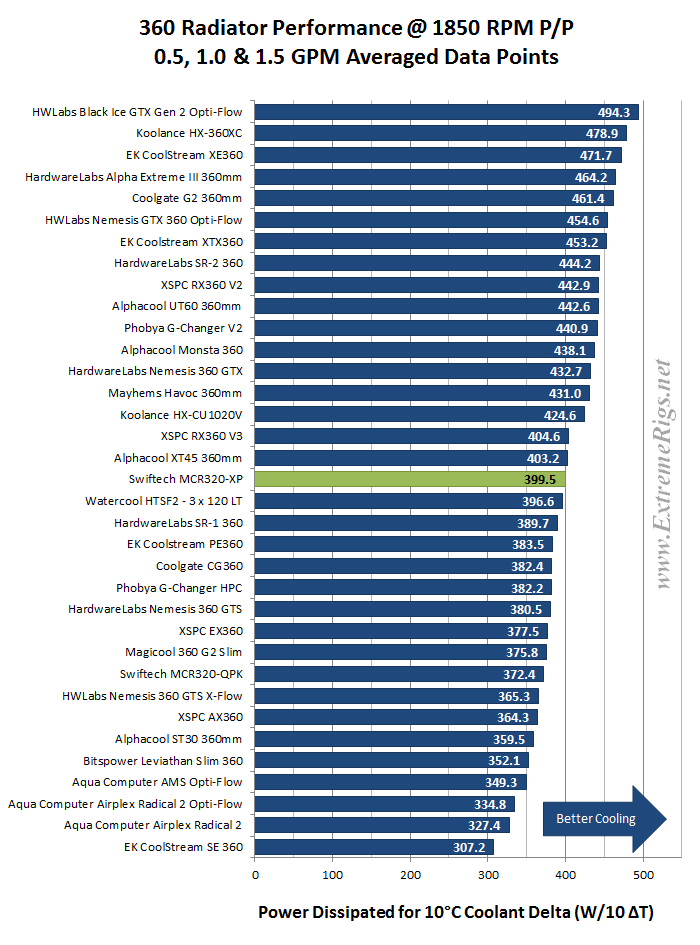
Now 1850 rpm:
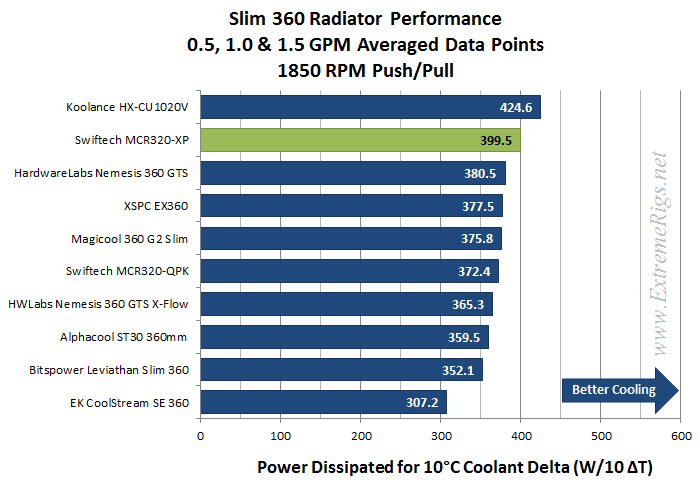 1850 rpm Push/Pull is possibly an exception to our “no Push/Pull for slim radiators” recommendation. The best performers (any thickness 360mm Push Only) are running just North of 400 W/10ΔT, so the MCR320-XP’s 399.5 Push/Pull result certainly competes performance wise and is worth a consideration, but probably only if you already have the radiator and/or the six fans required.
It is unlikely that the cost difference between purchasing the MCR320-XP and 6 new fans will be less than the outlay for a decent performing thick radiator and 3 new fans, yet both assemblies are capable of similar performance.
To save you looking back for the relevant chart 🙂
Let’s now combine the Push Only and Push/Pull results for our slim 360mm radiators at 1.0 GPM for each fan speed so we see both sets of results on the same plot. Sometimes these combined plots show up some points of interest, however they are long, so again a spoiler has been used.
From all the test results we created “Average Performance Factor” charts for both Push and Push/Pull. We then made a combined plot of the average called the “Master Performance Factor”. The radiator with the best cooling ability (W/10ΔT) at each rpm was awarded a score of 100. Each other radiators W/10ΔT result was scored as percentage of the top performer.
This way of looking at the comparison takes away any advantages that a radiator may have at higher or lower fan speeds and looks at an overall average. While this appears fair it does tend to favor those radiators that are all-rounders and those radiators which do very well at high RPM. Most users should be more focused on their specific use case.
Here are the MCR320-XP’s percentage scores at each data point:
This table confirms that the MCR320-XP was one of the stronger performers in our slim 360mm test group. It’s best comparison results (closest to the winner) was in Push/Pull at 1300 RPM while it enjoyed it’s highest rankings with the P/P 1850 RPM high-speed fan tests. For Push Only is had rather weak performance with low-speed fans, but got better as the fan speed was increased.
As the percentage scores in the table above are relative to the best performer at each data point, we again advise readers to cross reference specifications and results for each radiator and keep in mind your intended fan assembly and operating speed.
The percentage numbers above offer another way of looking at the MCR320-XP’s results. But for our scoring system we need a way to reduce the categories while retaining the data. To do this we average the results for each fan assembly type giving us Averaged Performance Factors. We calculate this for Push Only, Push/Pull and finally an average of everything.
Firstly – the Push Only APF:
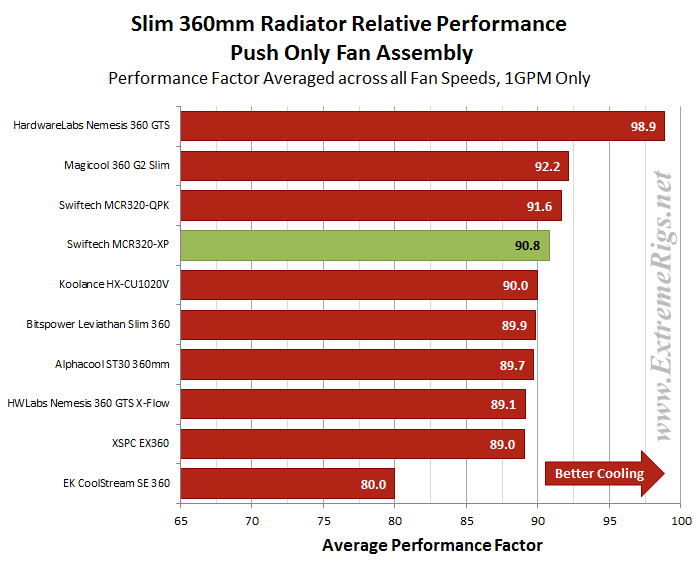 With a 90.8 % Averaged Push Only result the MCR320-XP finished as the 4th strongest performing radiator of the test group. The result is buoyed by it’s strong performance with high-speed fans. While it results were competitive results with low and medium speed fans, it was lower in the rankings for those two tests.
Now the Push/Pull APF:
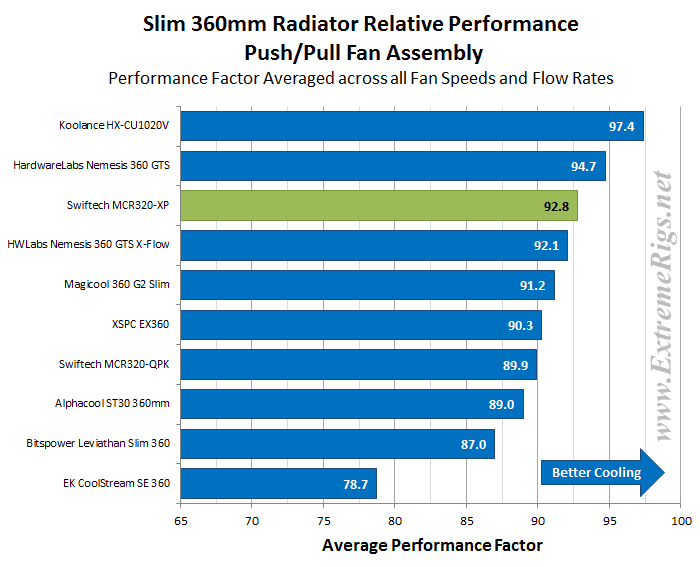 In the Push/Pull APF the MCR320-XP finishes in 3rd place with a 92.8 Push/Pull APF score. It placed 2nd or 3rd at very data point for medium and high speed fans, but trailed a bit behind and had low rankings for every low speed fan.
Finally for thermal performance we created the Master Performance Factor which is calculated from the averaged results of all the Push Only and Push/Pull thermal tests, at all fan speeds and flow rates.
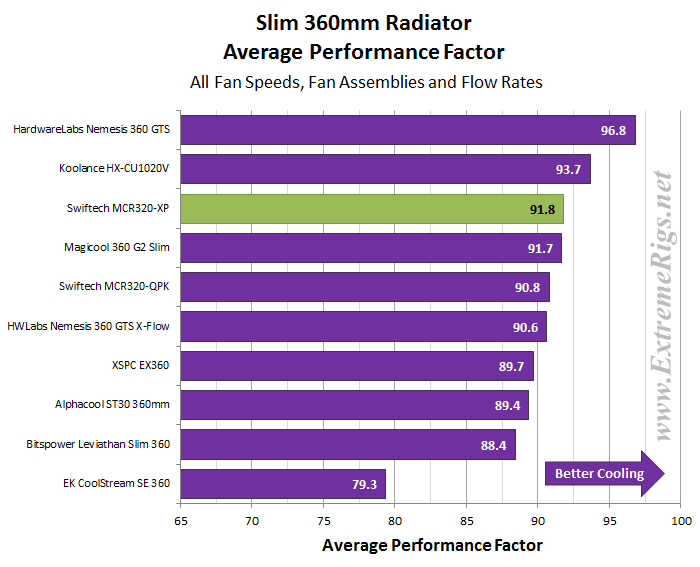 The MPF result of 91.8 places the MCR320-XP in 3rd, just above a very tighly grouped pack which were all within 4% of each other.
Space Efficiency
The MCR320-XP’s space efficiency vs. performance is unlikely to result in a high score against the other slim radiators because it is the equal second thickest of the group. We have used the Average Performance Factor results from the charts above to compile two plots which shows us how it compares to the other radiators in terms of performance Vs. space taken.
Firstly is radiator thickness Vs. APF
Here the combined APF scores were divided by the only radiator thickness, with the highest (most space efficient) issued a score of 100. Each of the other radiators results was converted to a percentage of the most space efficient radiator’s score.
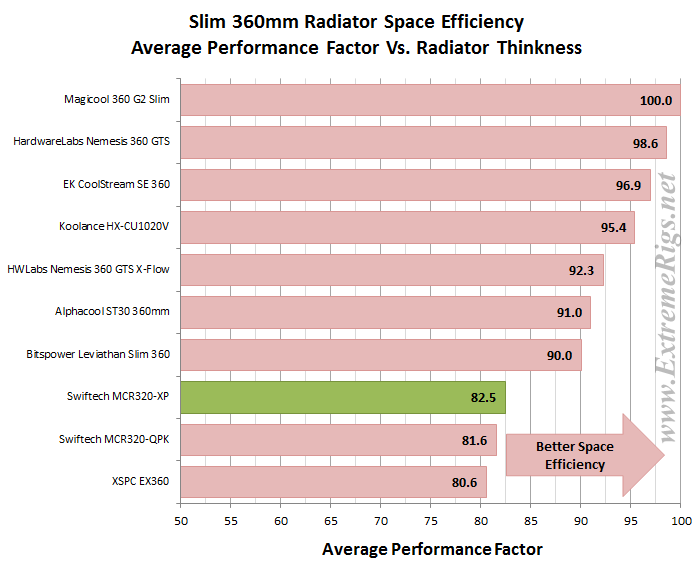
The results end almost in order of thinnest to thickest. This is particularly true when comparing to all radiators and not just slim results.
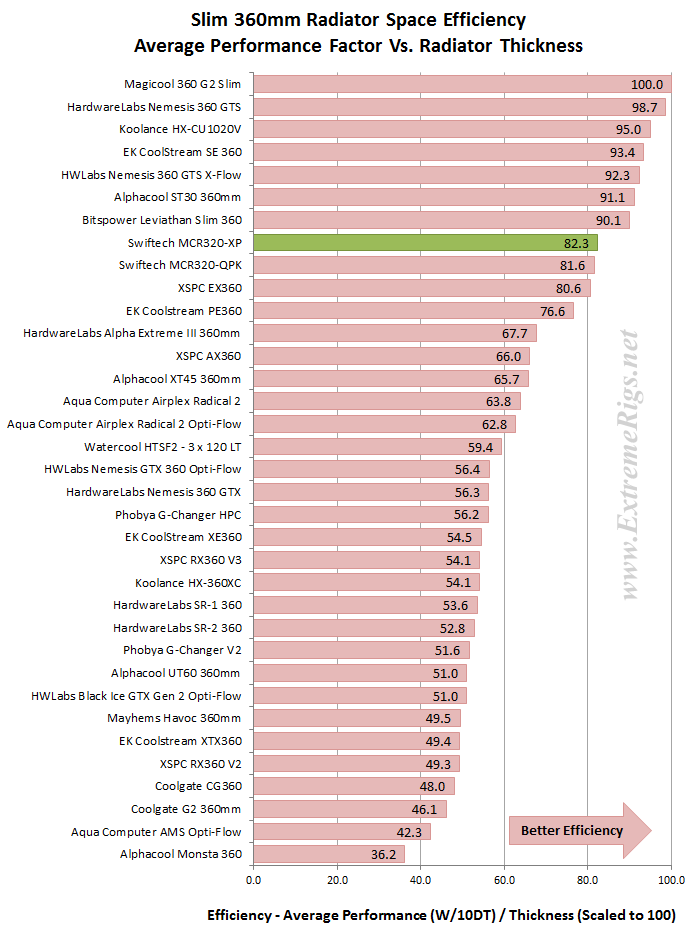
Next we took the APF results for Push/Pull and divided it by the total thickness including the fans and applied the same scoring system. For the Push Only we used the Push Only Vs Push/Pull comparative results and applied the same scoring system when compared against the Push/Pull.
The rankings are ordered for Push Only as that is the most efficient fan assembly and each radiator’s Push/Pull result are placed un-ordered, just below it’s ranked Push Only score.
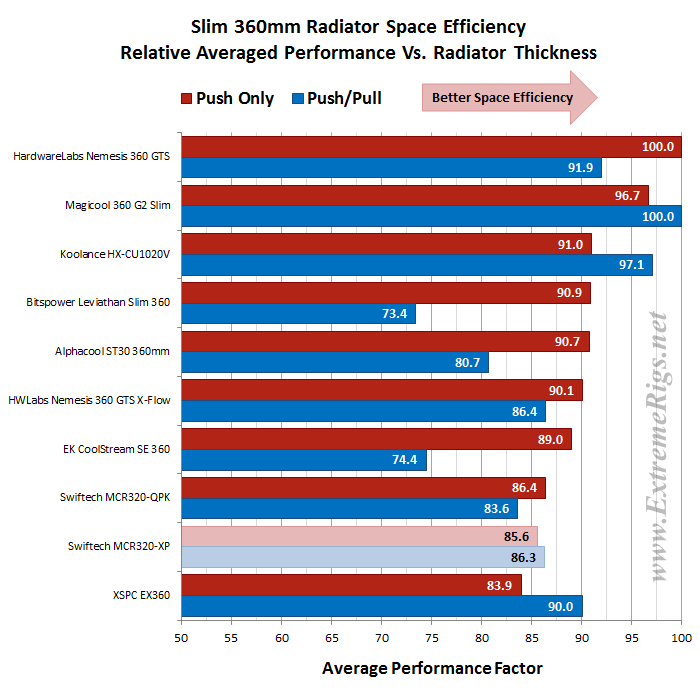 This plot is likely the most useful for readers of the 2 plots for space efficiency even though it is harder to decipher, especially the Push/Pull rankings. With fan thickness factored in the MCR320-XP finishes 2nd last for Push Only but the 86.3 Push/Pull result is 6th.
Value Factor
While our APF’s are still fresh in mind, let’s now look at some performance results vs radiator price to show which of the 360mm radiators might offer the best bang for your buck. Each radiator’s combined APF scores were divided by the radiator cost and again we applied our scoring system of percentage Vs. the best performer of the category.
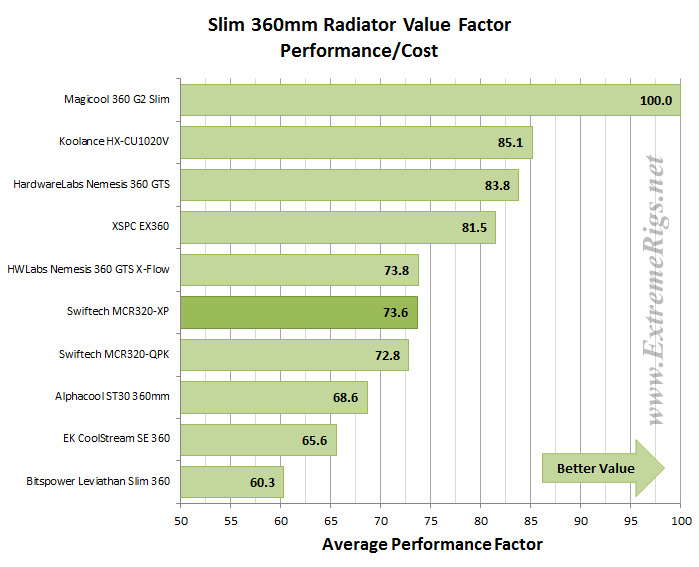 The MCR320-XP’s Value Factor turns out looking to be quite low. In fact the majority of the field score low due to the aggressively priced Magicool radiator. The average price for the group is ~$65. The Swiftech models are both $68 while the Magicool retails for $50. This $50 price has a significant impact on the other radiators value metric.
Next Up – Summary!


