


The Thermal Data
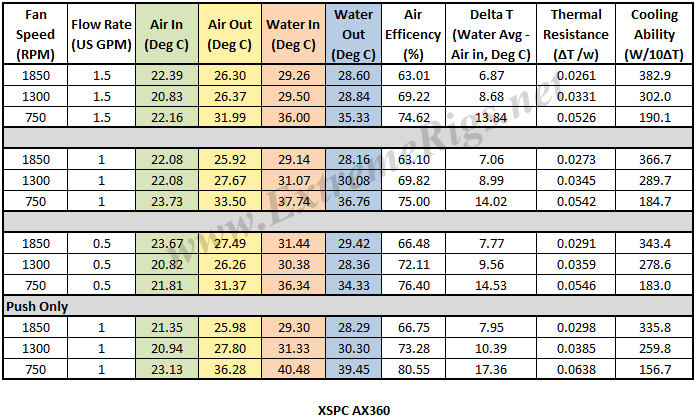
Moving on from the restriction bench the XSPC AX360 was loaded into the thermal chamber for a series of 12 tests – consisting of 3 flow rates for Push/Pull and a single flow rate for Push Only, each having 3 different fan rpm speeds tested.
Below is the final data results gathered from at least 5 data logging runs at each flow rate and fan rpm combination. The most stable 15 minute period from each logging run was used and then averaged with the other runs to obtain the data for the table below. A total of 16 temperature sensors were used in the thermal test chamber (8 air in, 2 air out, 3 water in, 3 water out) each take a reading every second and logged via a CrystalFontz unit. The data in the table below is the averaged results of the logging runs which has then been used to create all the plots and tables there-after.
A performance metric of critical importance is the delta between the warm coolant temperature and the cool ambient air temperature going into the radiator. Given that the system is well insulated, in equilibrium and we know the heat input to the system then we can also calculate some other very important numbers. The most useful for the end user is the amount of power being dissipating from the coolant. That amount is typically 1C or 10C with the latter being more useful as a reference point. This W/10DT or W/10ΔT is the calculation used for our thermal performance assessments and comparisons.
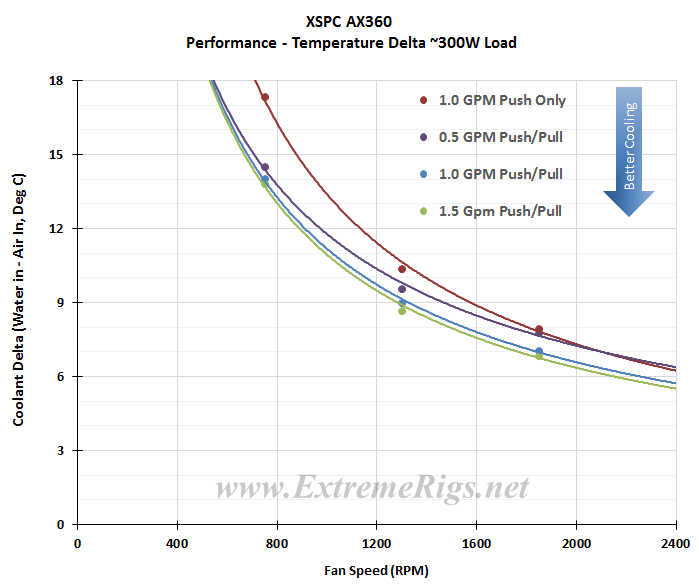
Let’s take a look at the Delta T results from the tests, firstly plotted with extrapolation and followed by a bar chart. Note that the extrapolation of the curve is much more sensitive to error than in the tested range.
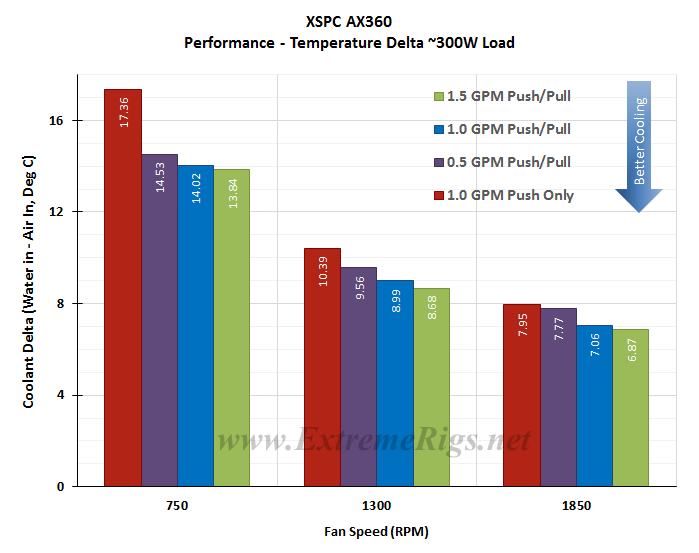 I was not too concerned about the actual delta numbers but instead the trend pattern. As we should expect, the deltas come down significantly as the fan speed is increased.
Delta T results (as above) are not always helpful when thinking about how many radiators you would need to cool your system. Instead it’s more useful to know the metric of W/Delta C. This metric is plotted below. It tells us how many Watts are dissipated by the radiator when the coolant rises 10C above ambient temperatures (W/10ΔT).
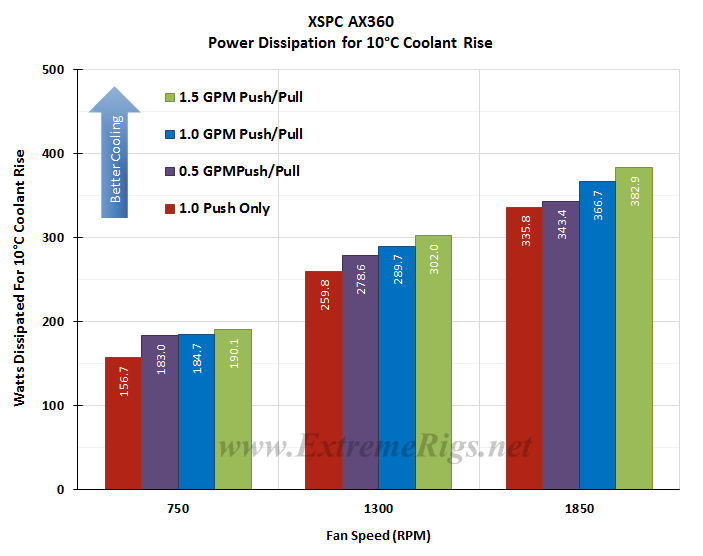 Of interest is the lack of any significant separation between the performance of each flow rate at the tested fan speeds. This indicates the AX360 is tuned for low flow rates and increasing it yields only small performance increases.
This same data can now be plotted on a chart so that an end user can interpolate their own fan speed. Note again that the extrapolation of the curve is much more sensitive to error than in between the tested range.
Let’s exclude the push data for now and come back to it:
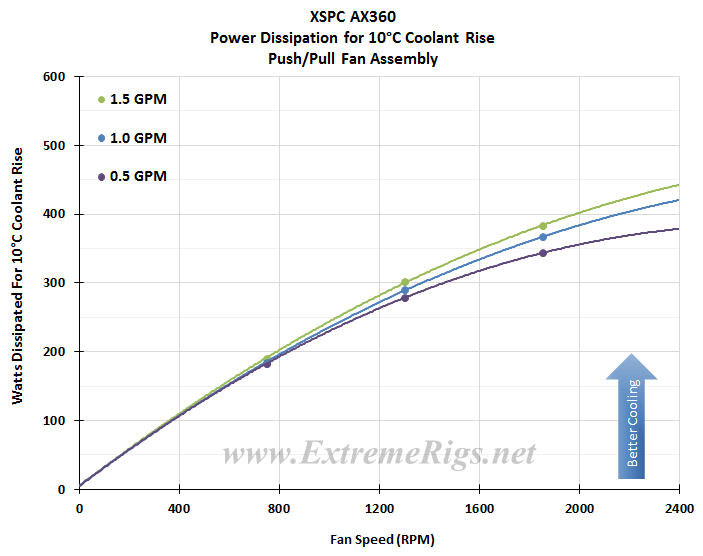 This plot clearly shows that flow rate has little impact on the AX360’s potential performance.
If we now come back to the Push Only data it’s good to compare the Push to Push/Pull data in an “apples to apples” fashion by only looking at the 1GPM data:
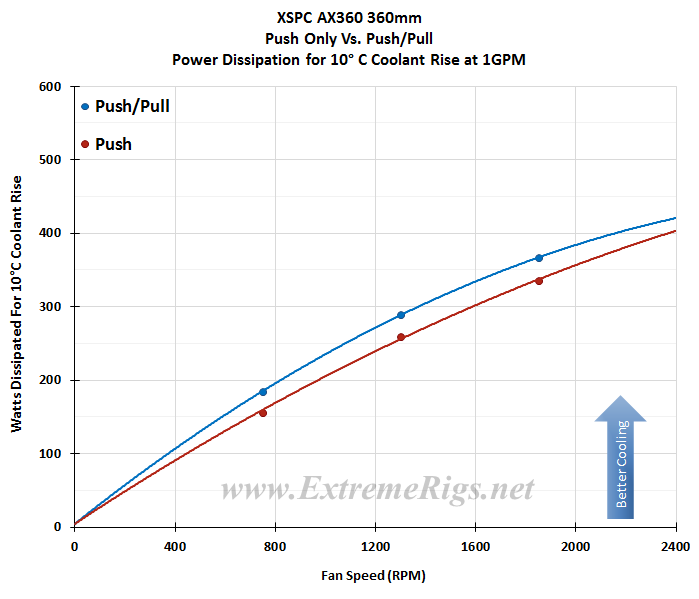 The average difference between Push Only and Push/Pull results at the same fan speed was ~11%, and ranged from ~15% at 750 rpm to ~8% at 1850 rpm. This small variance with high fan speeds falls in line with expectations as a slim core is able to operate very efficiently with a single set of high speed fans.
Now let’s analyze that data some more…


