


Testing
Testing mice is somewhat arbitrary and unstandardized sadly, but we will be using microe’s MouseTester software to do what we can here.
First off let’s look at the USB polling. The Deathadder Chroma boasts 1000Hz ultrapolling, as did the previous generation 2013 Deathadder. Let’s compare the 500Hz and 1000Hz settings of both, while also throwing in the 2000Hz mode of the ROG Gladius mouse. For this test we drew a spiral pattern and the MouseTester software recorded the latency between datapoints:
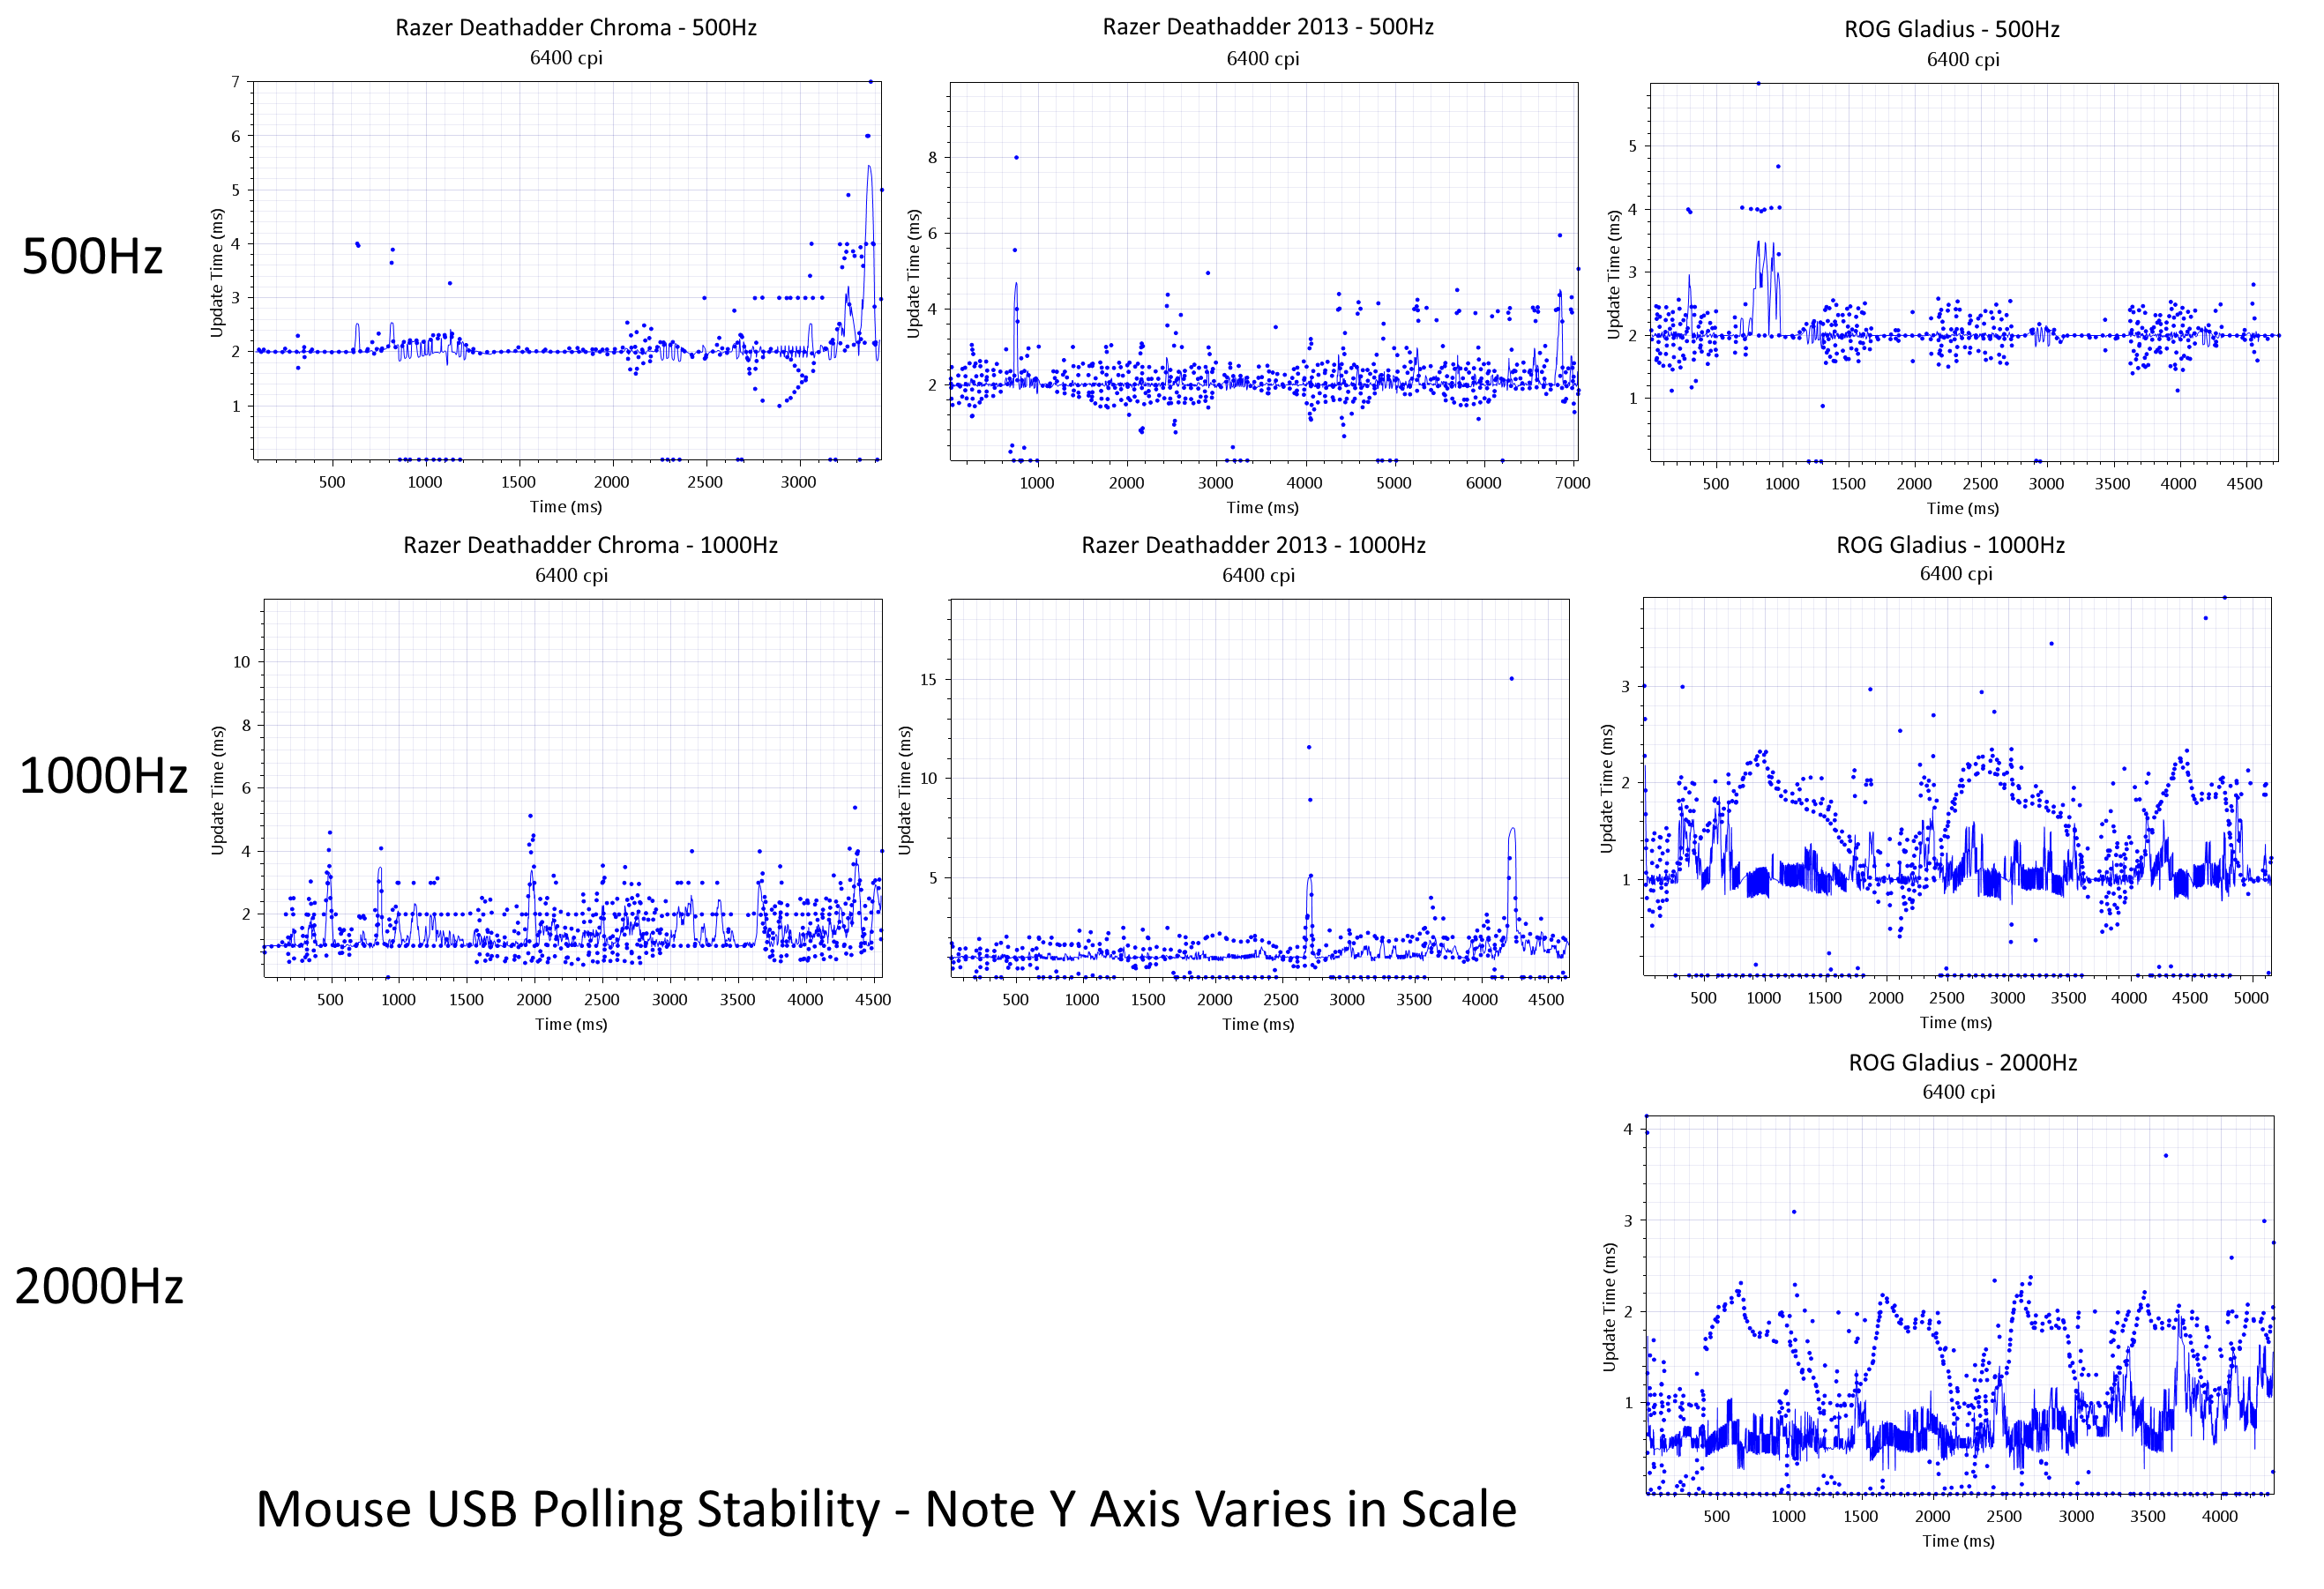
You will need to zoom in on that image to really look at the data. Bear in mind because the y axis varies that some plots look better than others.
There are two things to look for here – stability and outliers. Ideally the polling would be a flat line at 2ms for 500Hz, 1ms for 1000Hz and 0.5ms for 2000Hz. However we see that it is not quite perfect. Although it averages out to these numbers there can be some significant lag spikes.
At 500hz ~99% of the Chroma’s and Gladius’s data is below 4ms. However the Deathadder 2013 shows significantly worse behavior and a ton more jitter. It’s clear then that Razer have improved this performance.
At 1000Hz we start to see the Deathadder 2013 really struggle and we’d suggest that perhaps 500Hz is a better setting for it. However the Deathadder Chroma is no worse than it’s 500Hz performance, suggesting that the 1000Hz is a better setting for it even if it’s not truly giving 1ms intervals reliably. The Gladius on the other hand shows significantly better performance at 1000Hz.
At 2000Hz the Gladius is the only contender – and while it’s average latency is less, the lag spikes are about the same as the 1000Hz setting. Therefore it might be worthwhile to stick with the 1000Hz setting and avoid the extra load on the cpu and usb bus.
So for USB latency we can see that the Deathadder Chroma has been improved over the 2013, but ROG’s Gladius is fractionally better.
Accuracy vs CPI Setting
All these modern mice have variable accuracy (CPI) settings. We therefore chose a few settings and tested them with three different shapes – a spiral, a fast/slow diagonal and a bunch of circles. These movements are designed to pick out issues with certain settings due to aliasing. The sensor generally outputs the same data, but the software or firmware will process that data and report it to Windows differently. For tests like these it’s important to set Windows OS mouse sensitivity settings to 6/11 in order to avoid Windows also scaling any of the data.
Let’s start off with the swirl test at 1600 CPI:
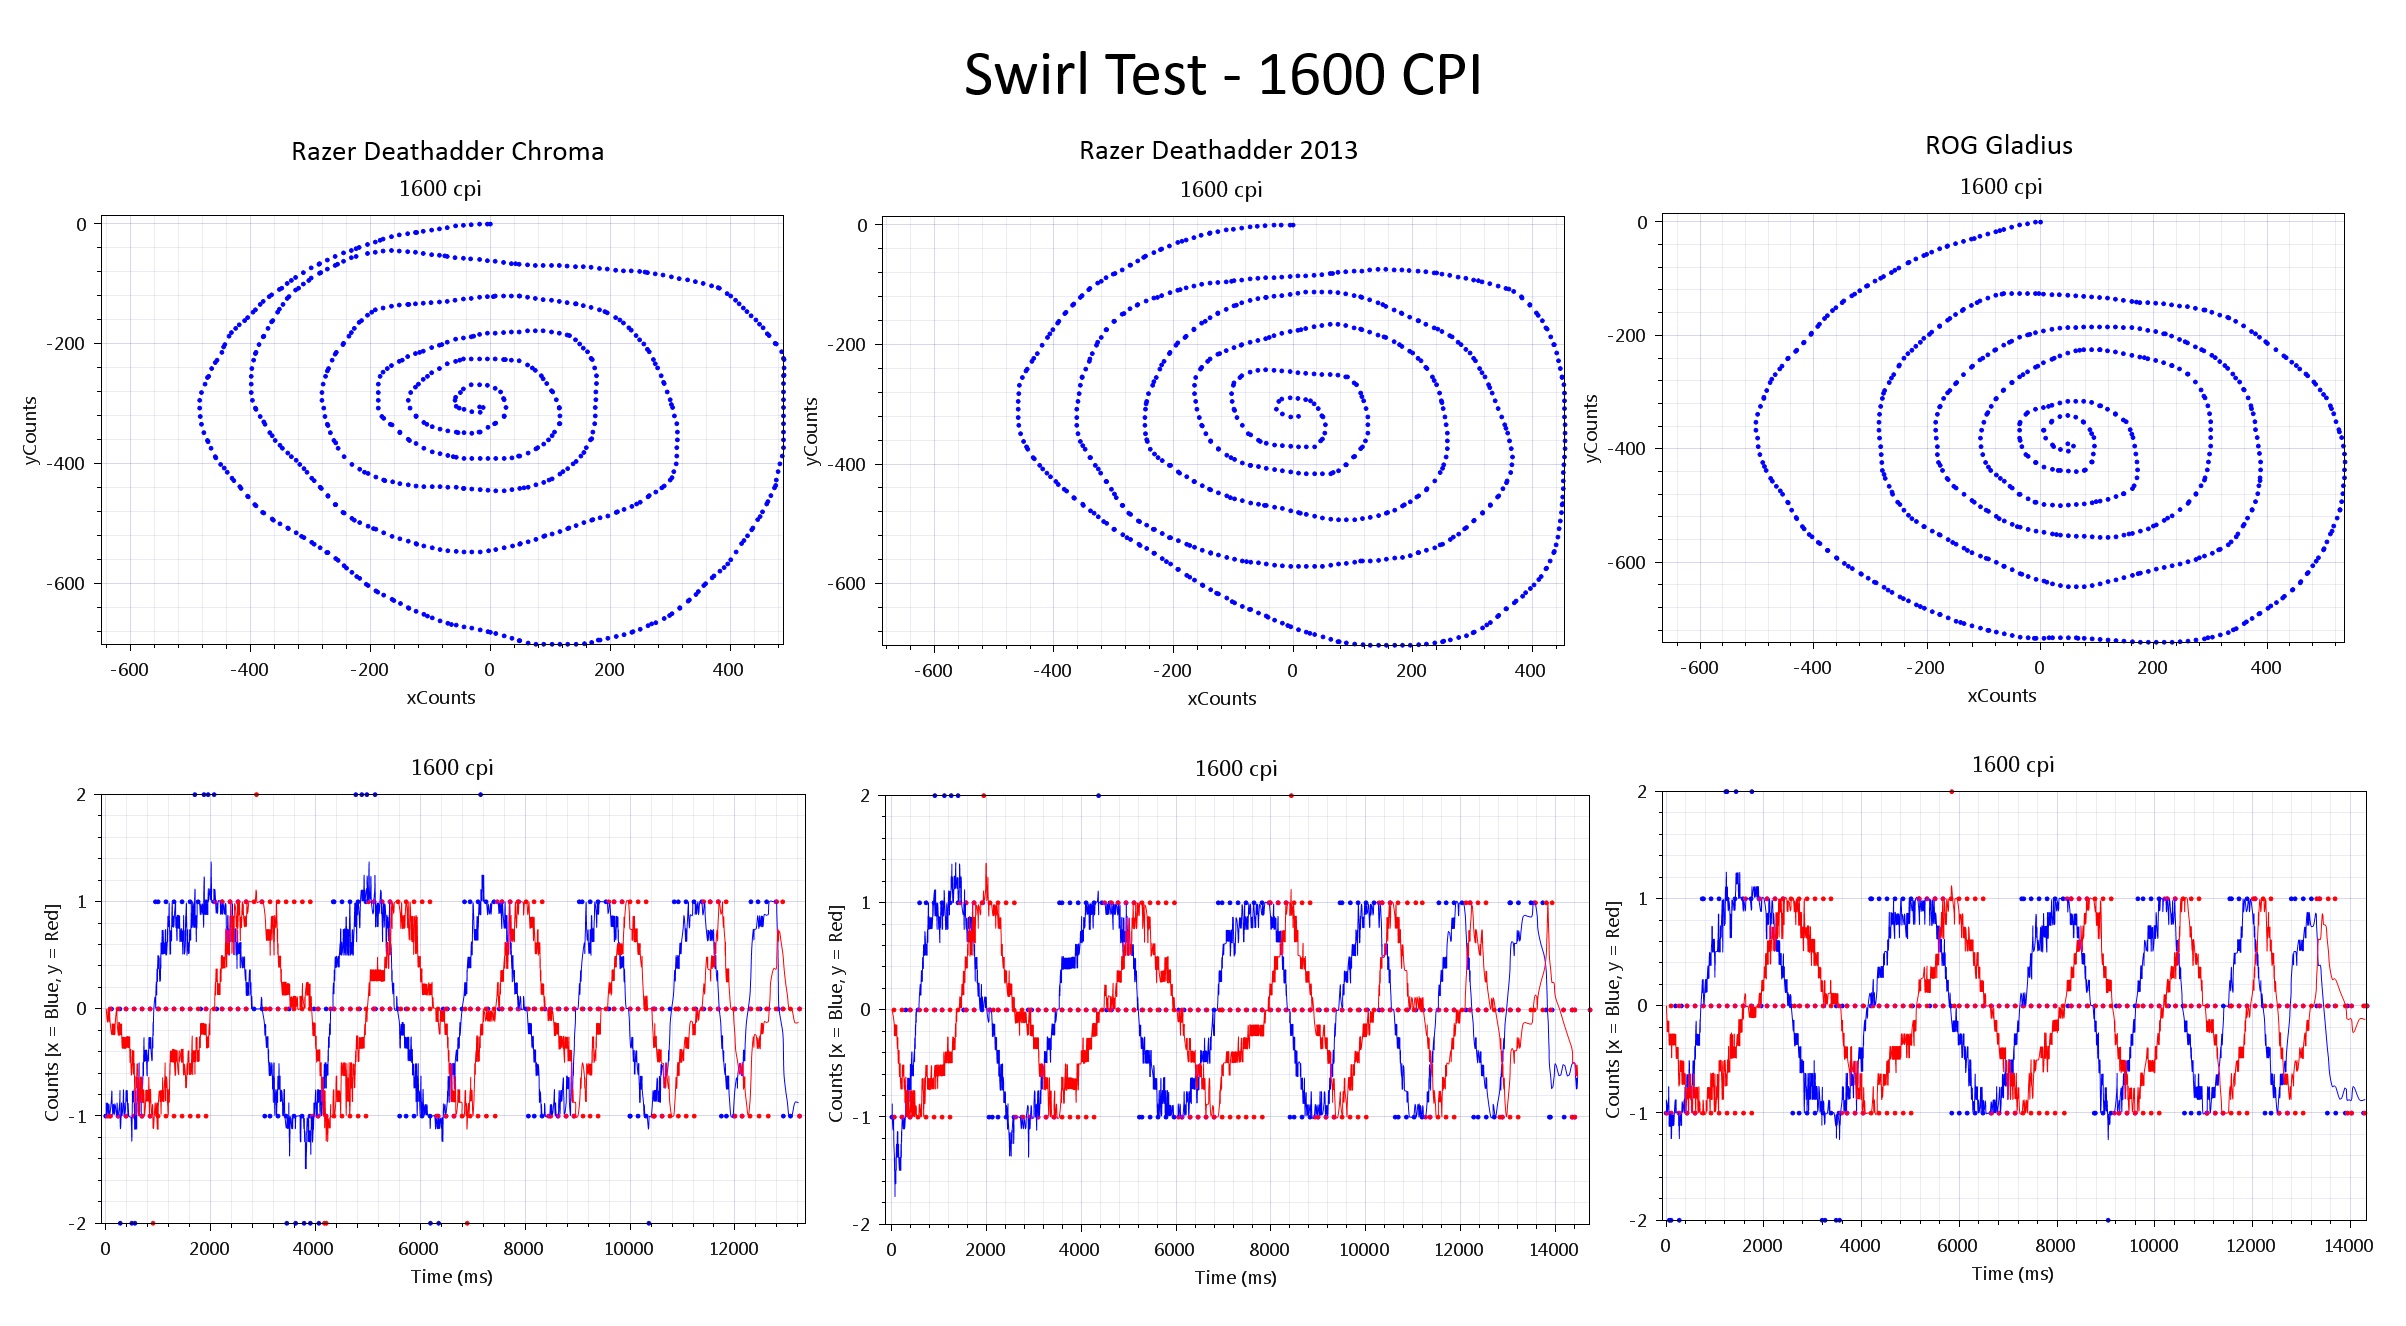
Here we don’t see much in the way of artifacts – curves are generally smooth if not very circular. It’s noticable that the Gladius curves are more circular – indicative of a smoother ride on the mousepad due it’s lower friction feet.
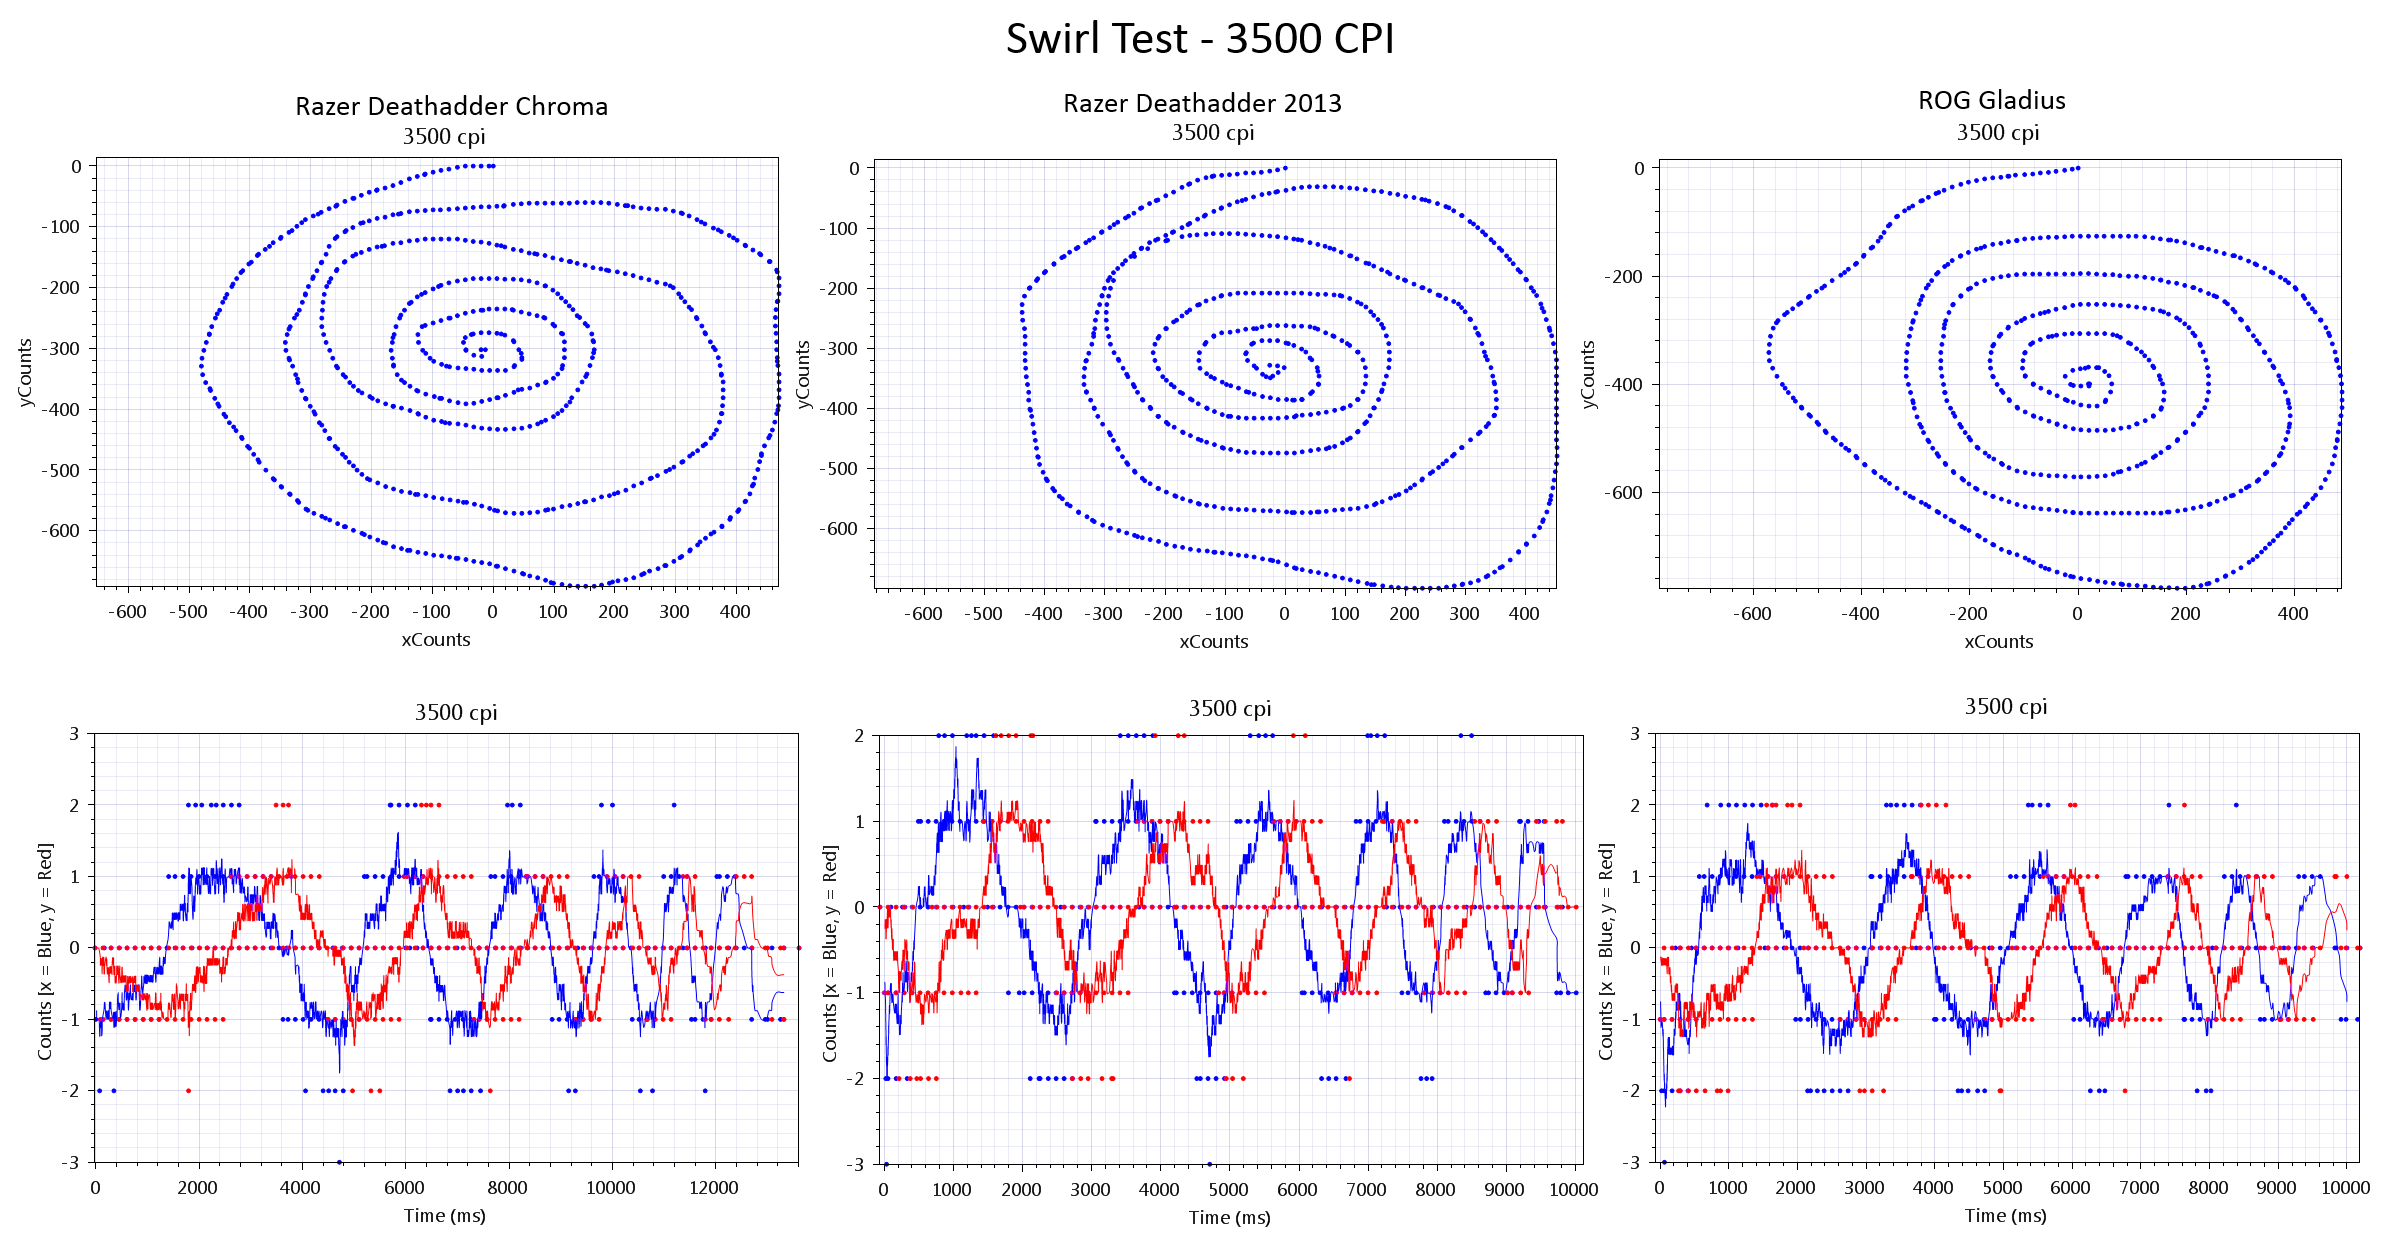
Bumping up to 3500 CPI we see much the same result:
At 6400 CPI we might expect to see some interesting things as this is the upper limit for two of the mice:
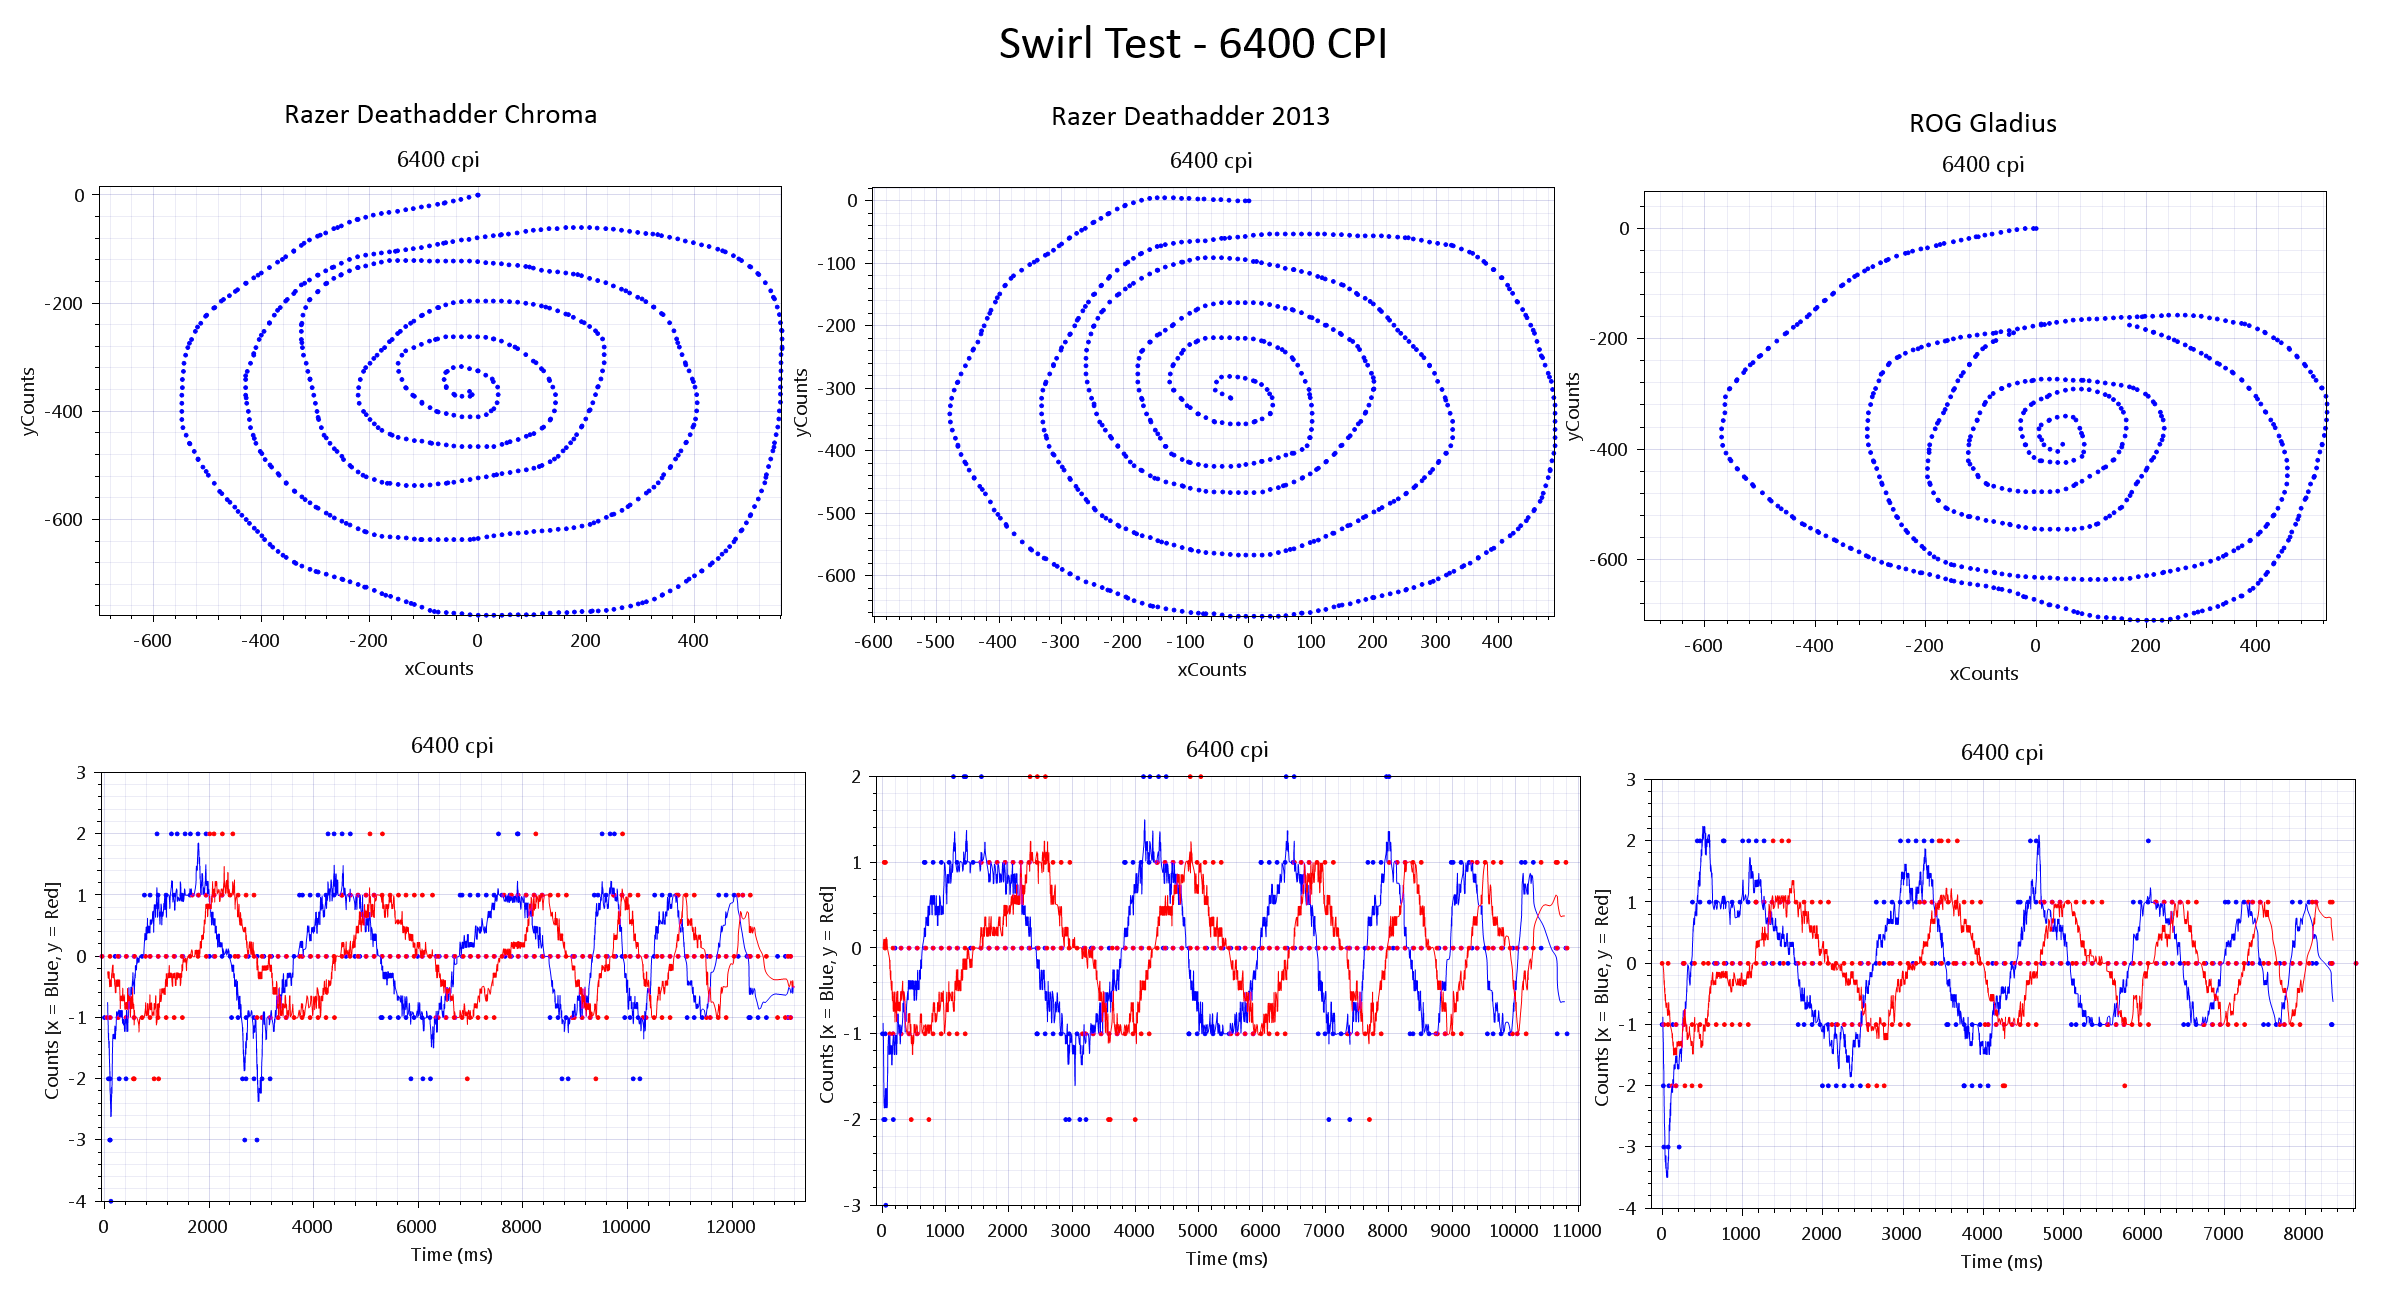
However the data looks quite consistent across all three mice. The Gladius is however showing a far worse looking spiral – as the CPI goes up the actual mouse movement becomes tighter and the lower friction feet of the Gladius may mean less control. It’s worth noting that the well used Deathadder 2013 which appears to have identical feet to the new Chroma felt much smoother in it’s motion – perhaps the feet have “worn in” over the few years it’s been used.
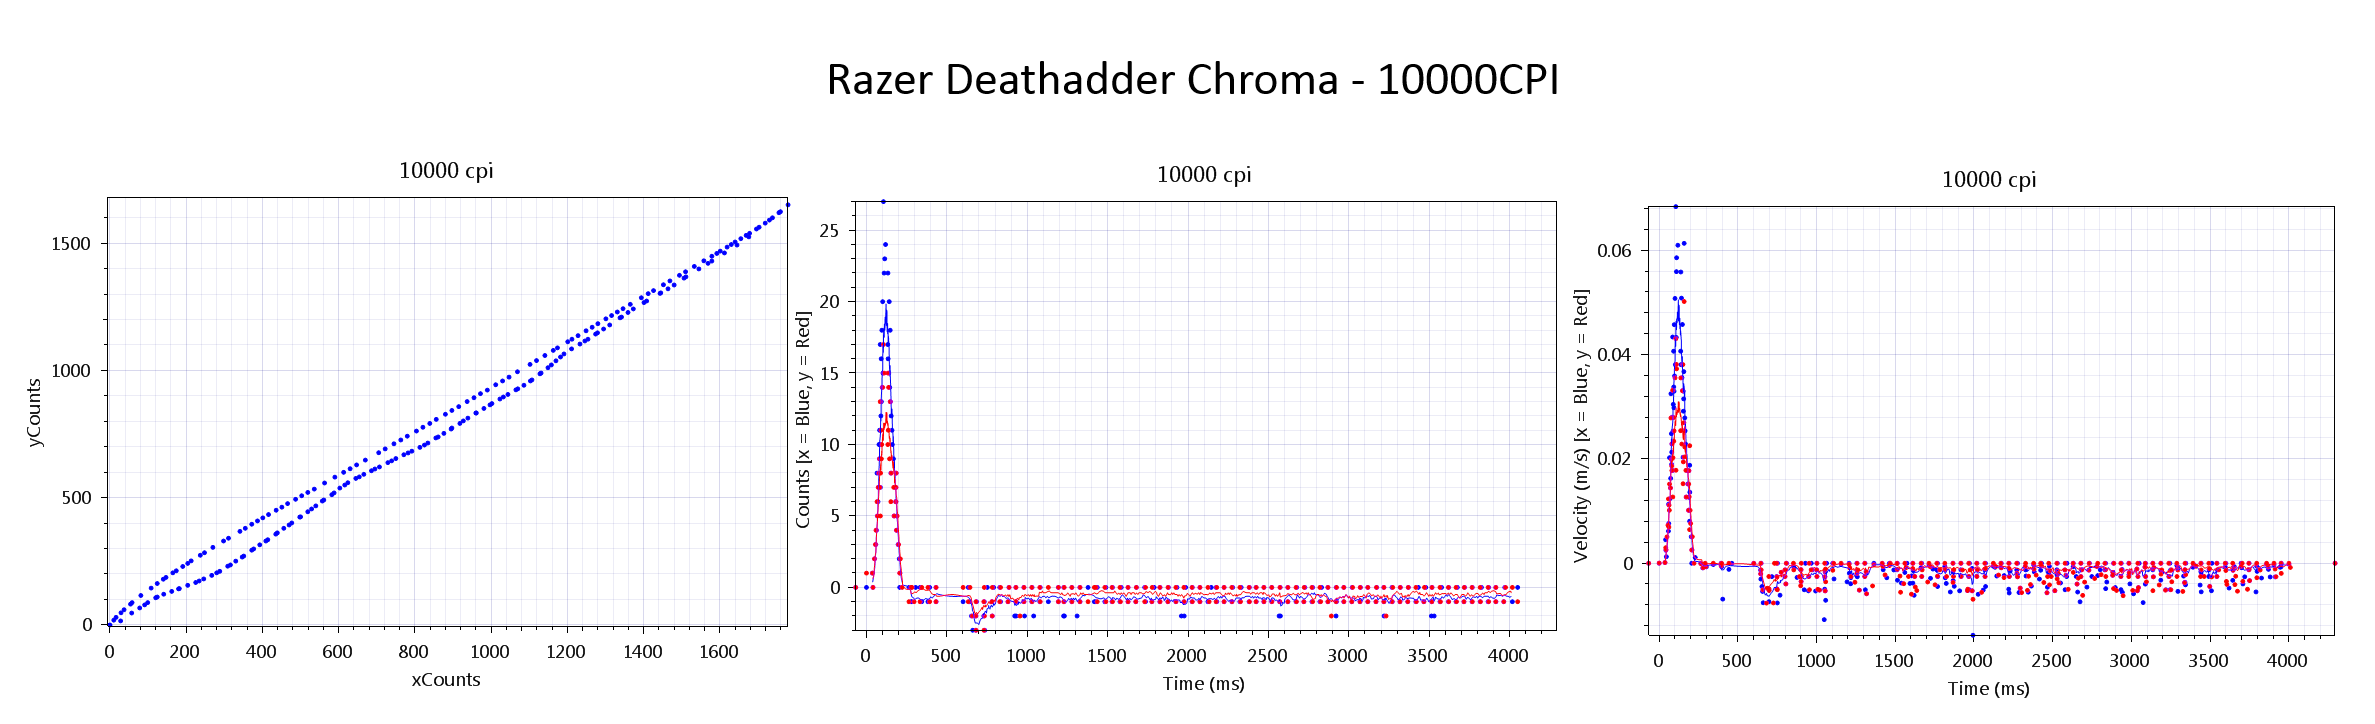
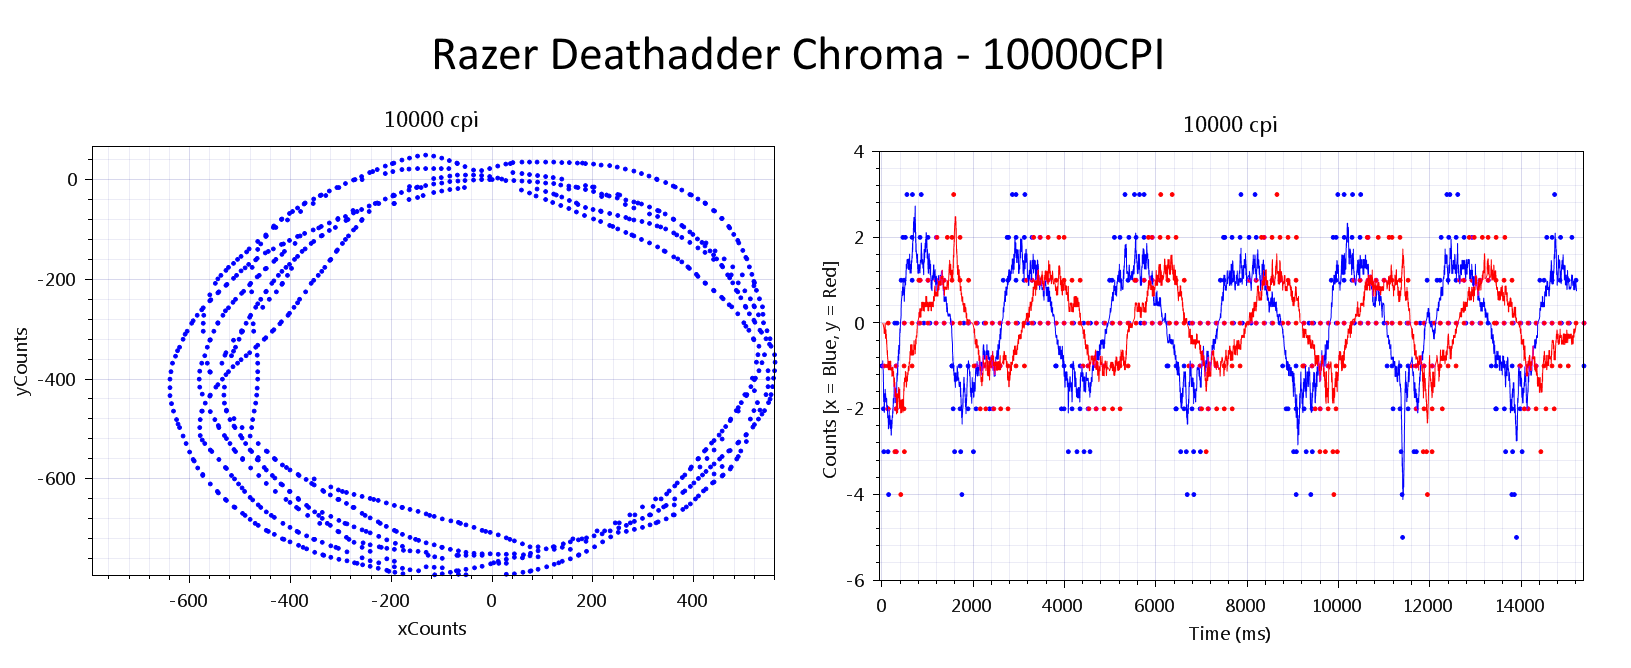
At 10000 CPI we have no one to compare to, however the data still looks reasonable:
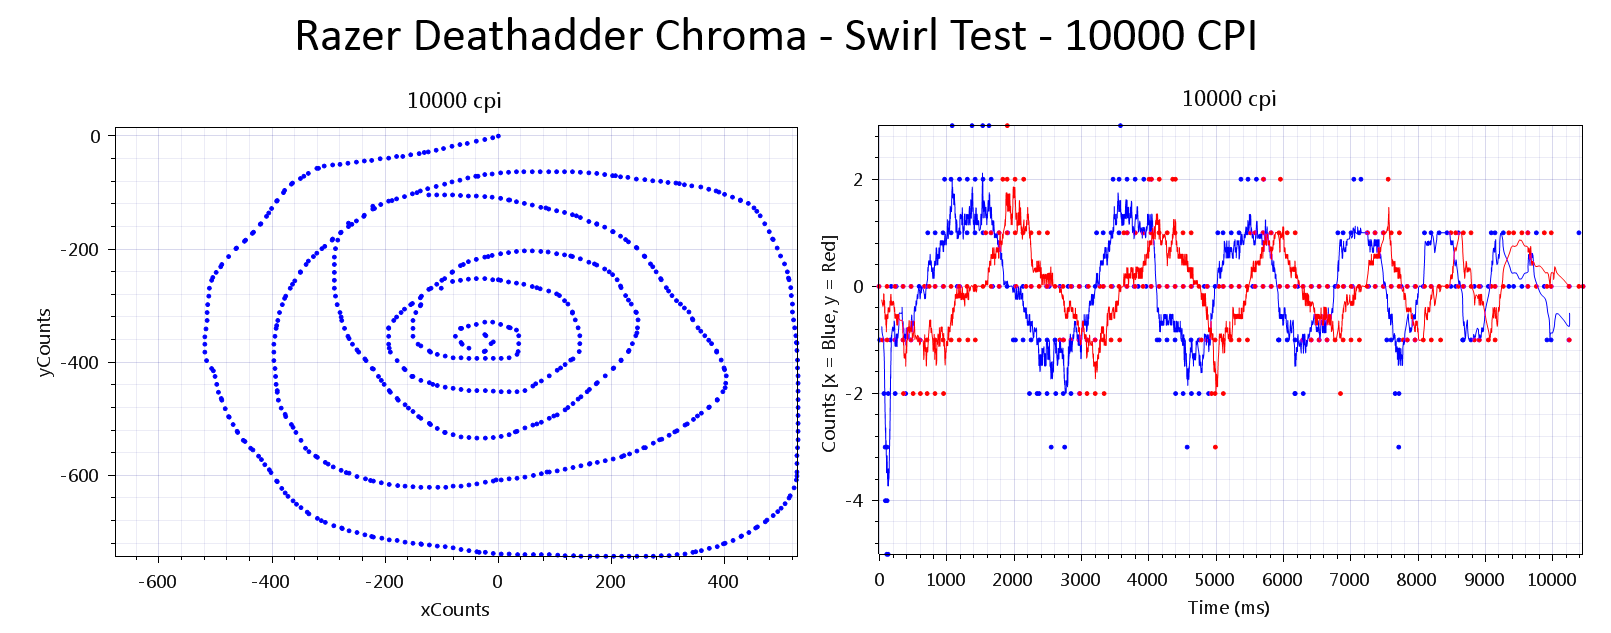
Note that the spiral looks quite ugly now, but it’s hard to judge how much of that is just from user input error as the spiral at this point is very small indeed.
“Diagonal” Test
The “diagonal” test involves moving the mouse diagonally quickly and returning it slowly to the point of origin. This tries to show if there are any errors because the mouse doesn’t track the two movements equally due to the difference in velocity. The start and end point should be the same.
Again let’s start with the 1600CPI setting. Note that we’ve also included the velocity plots:
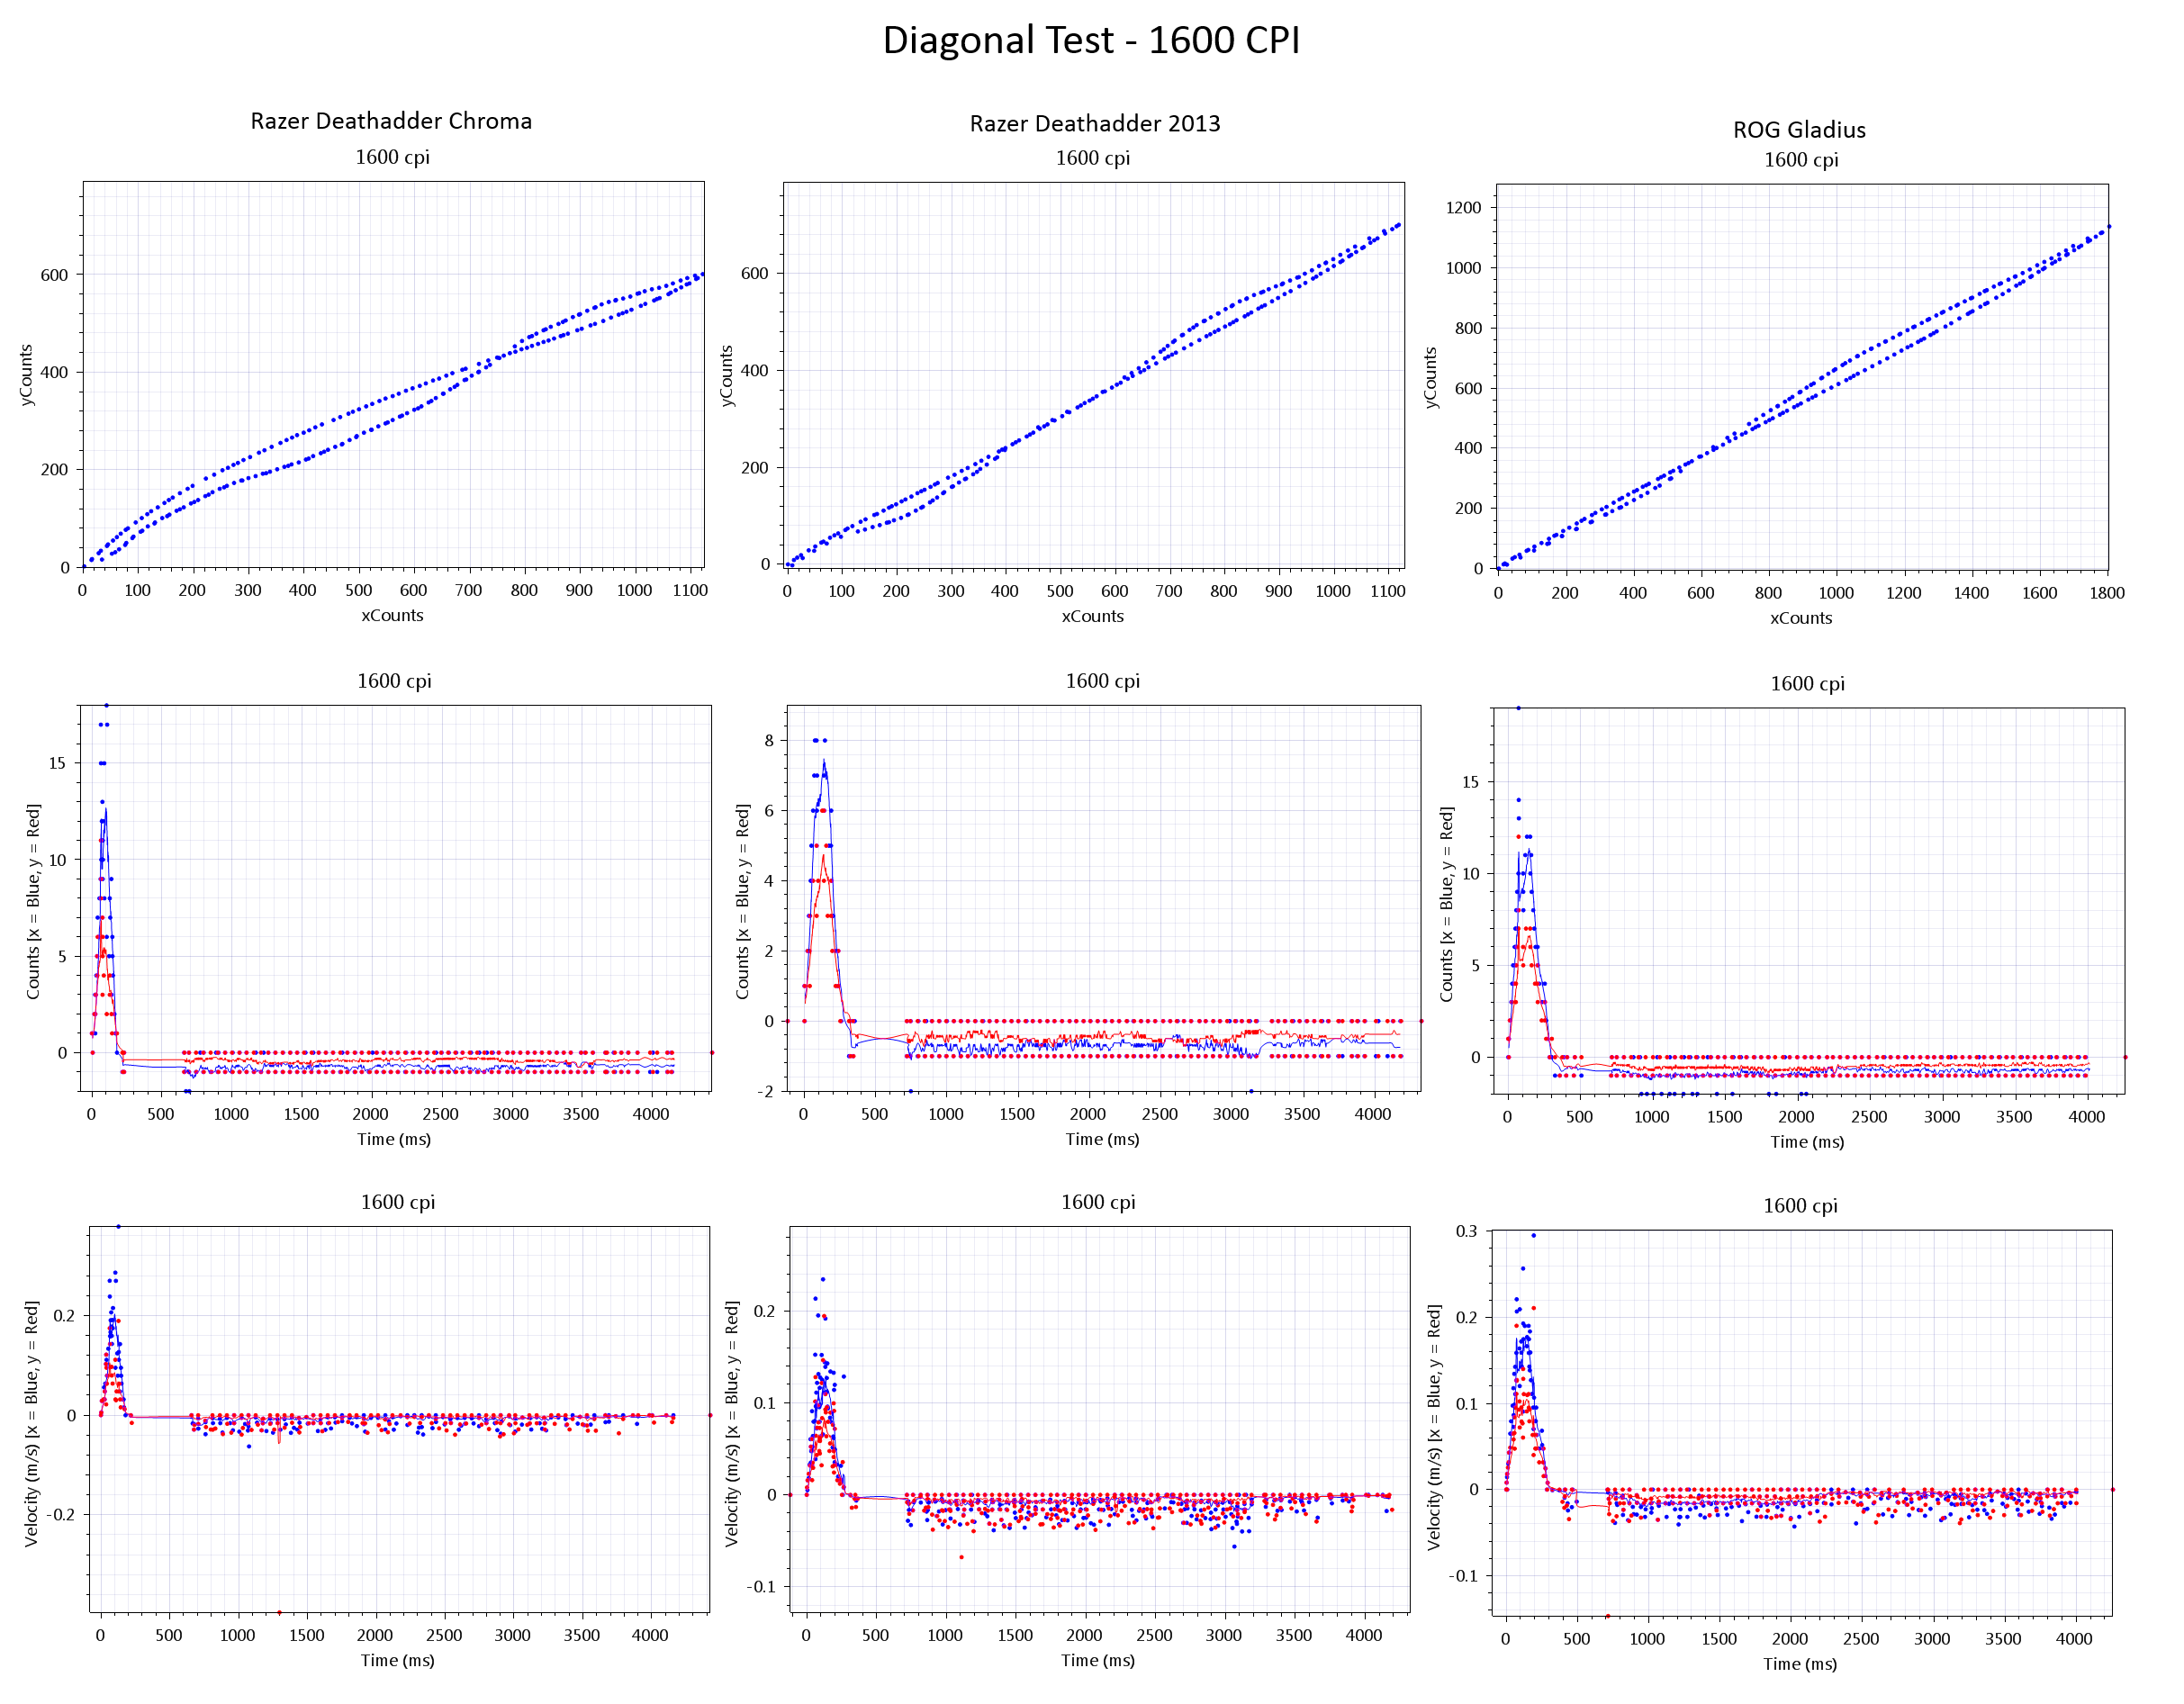
At 1600 CPI we wouldn’t expect to see any issues. Let’s move on to 3500 CPI:
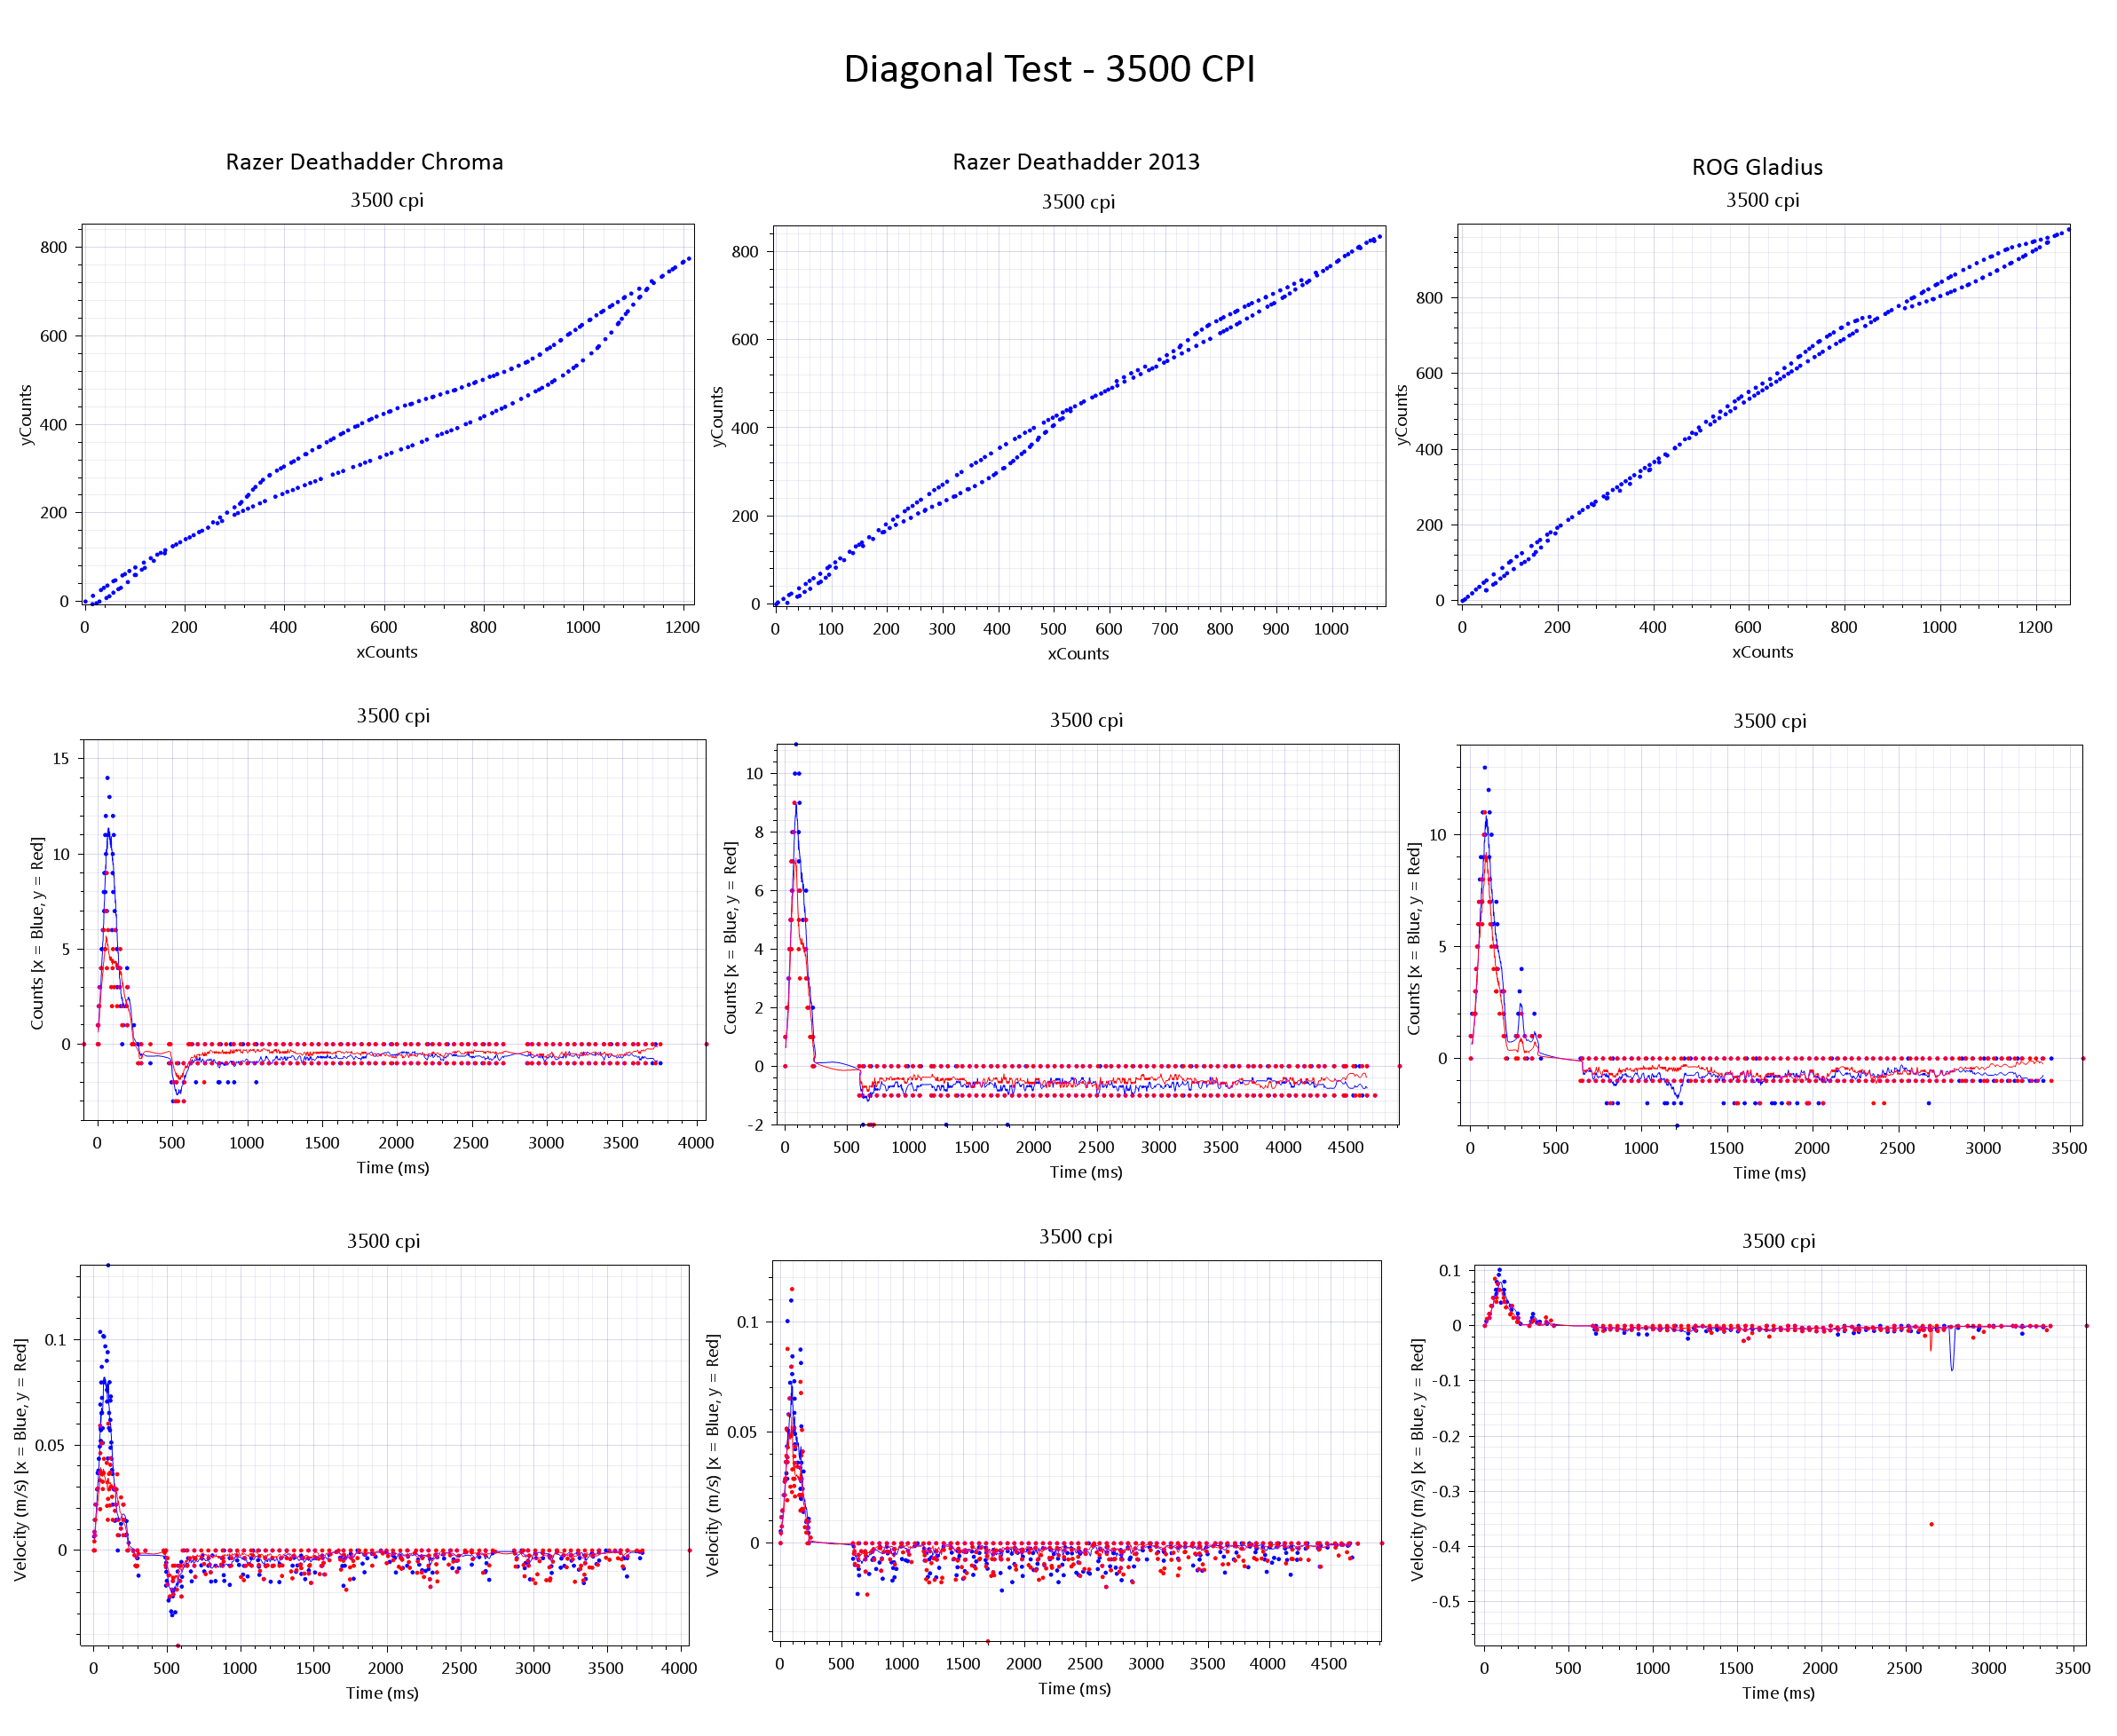
Again no problems here though it’s worth noting that the Chroma again had the most deviation – perhaps those “stiff” feet were again making “driving” difficult at these lower settings.
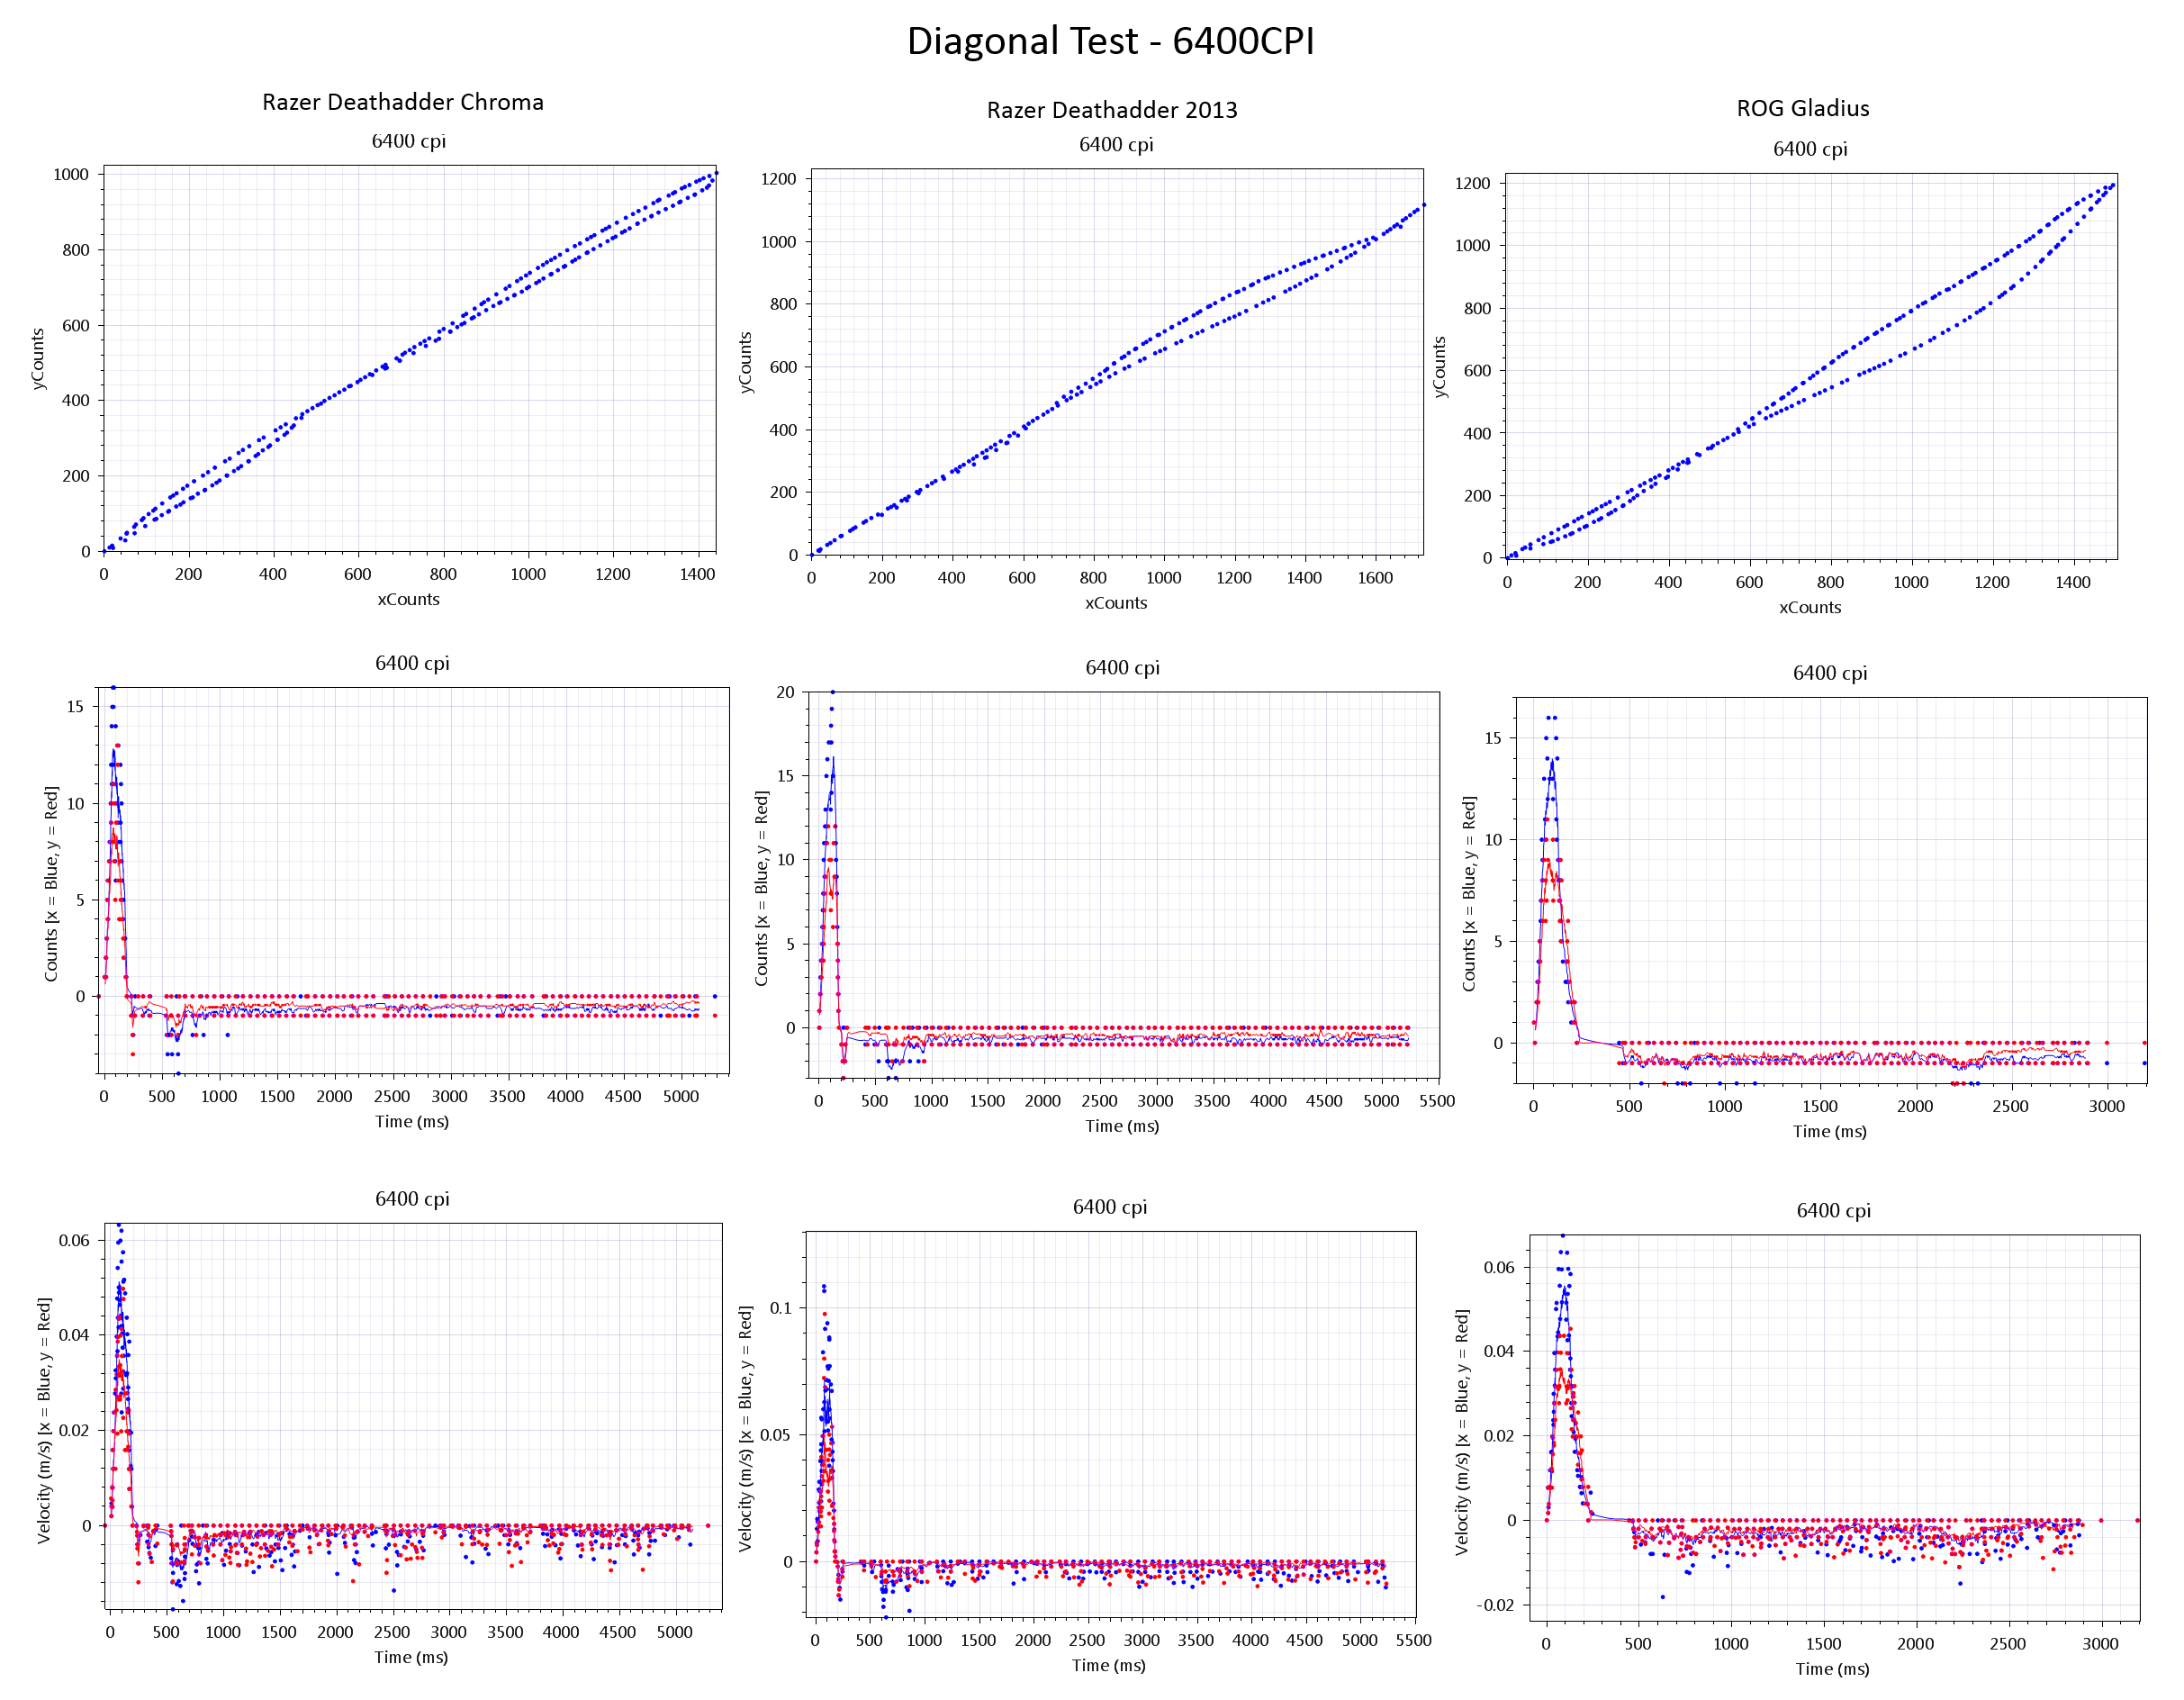
At 6400 CPI there are still no issues – though it’s worth again mentioning that the Chroma again seems to find itself performing accurately at 6400CPI.
Lastly at 10000 CPI we still see the Chroma perform well:
“Circle” Test
The “Circle” test involves drawing the same circle again and again. The idea is that if there are any issues causing the mouse to drift then they will appear here. Again non linearities may show and the smoothness of the circles may give a subtle indication of how smooth the mouse is to use. Again let’s start with 1600 CPI:
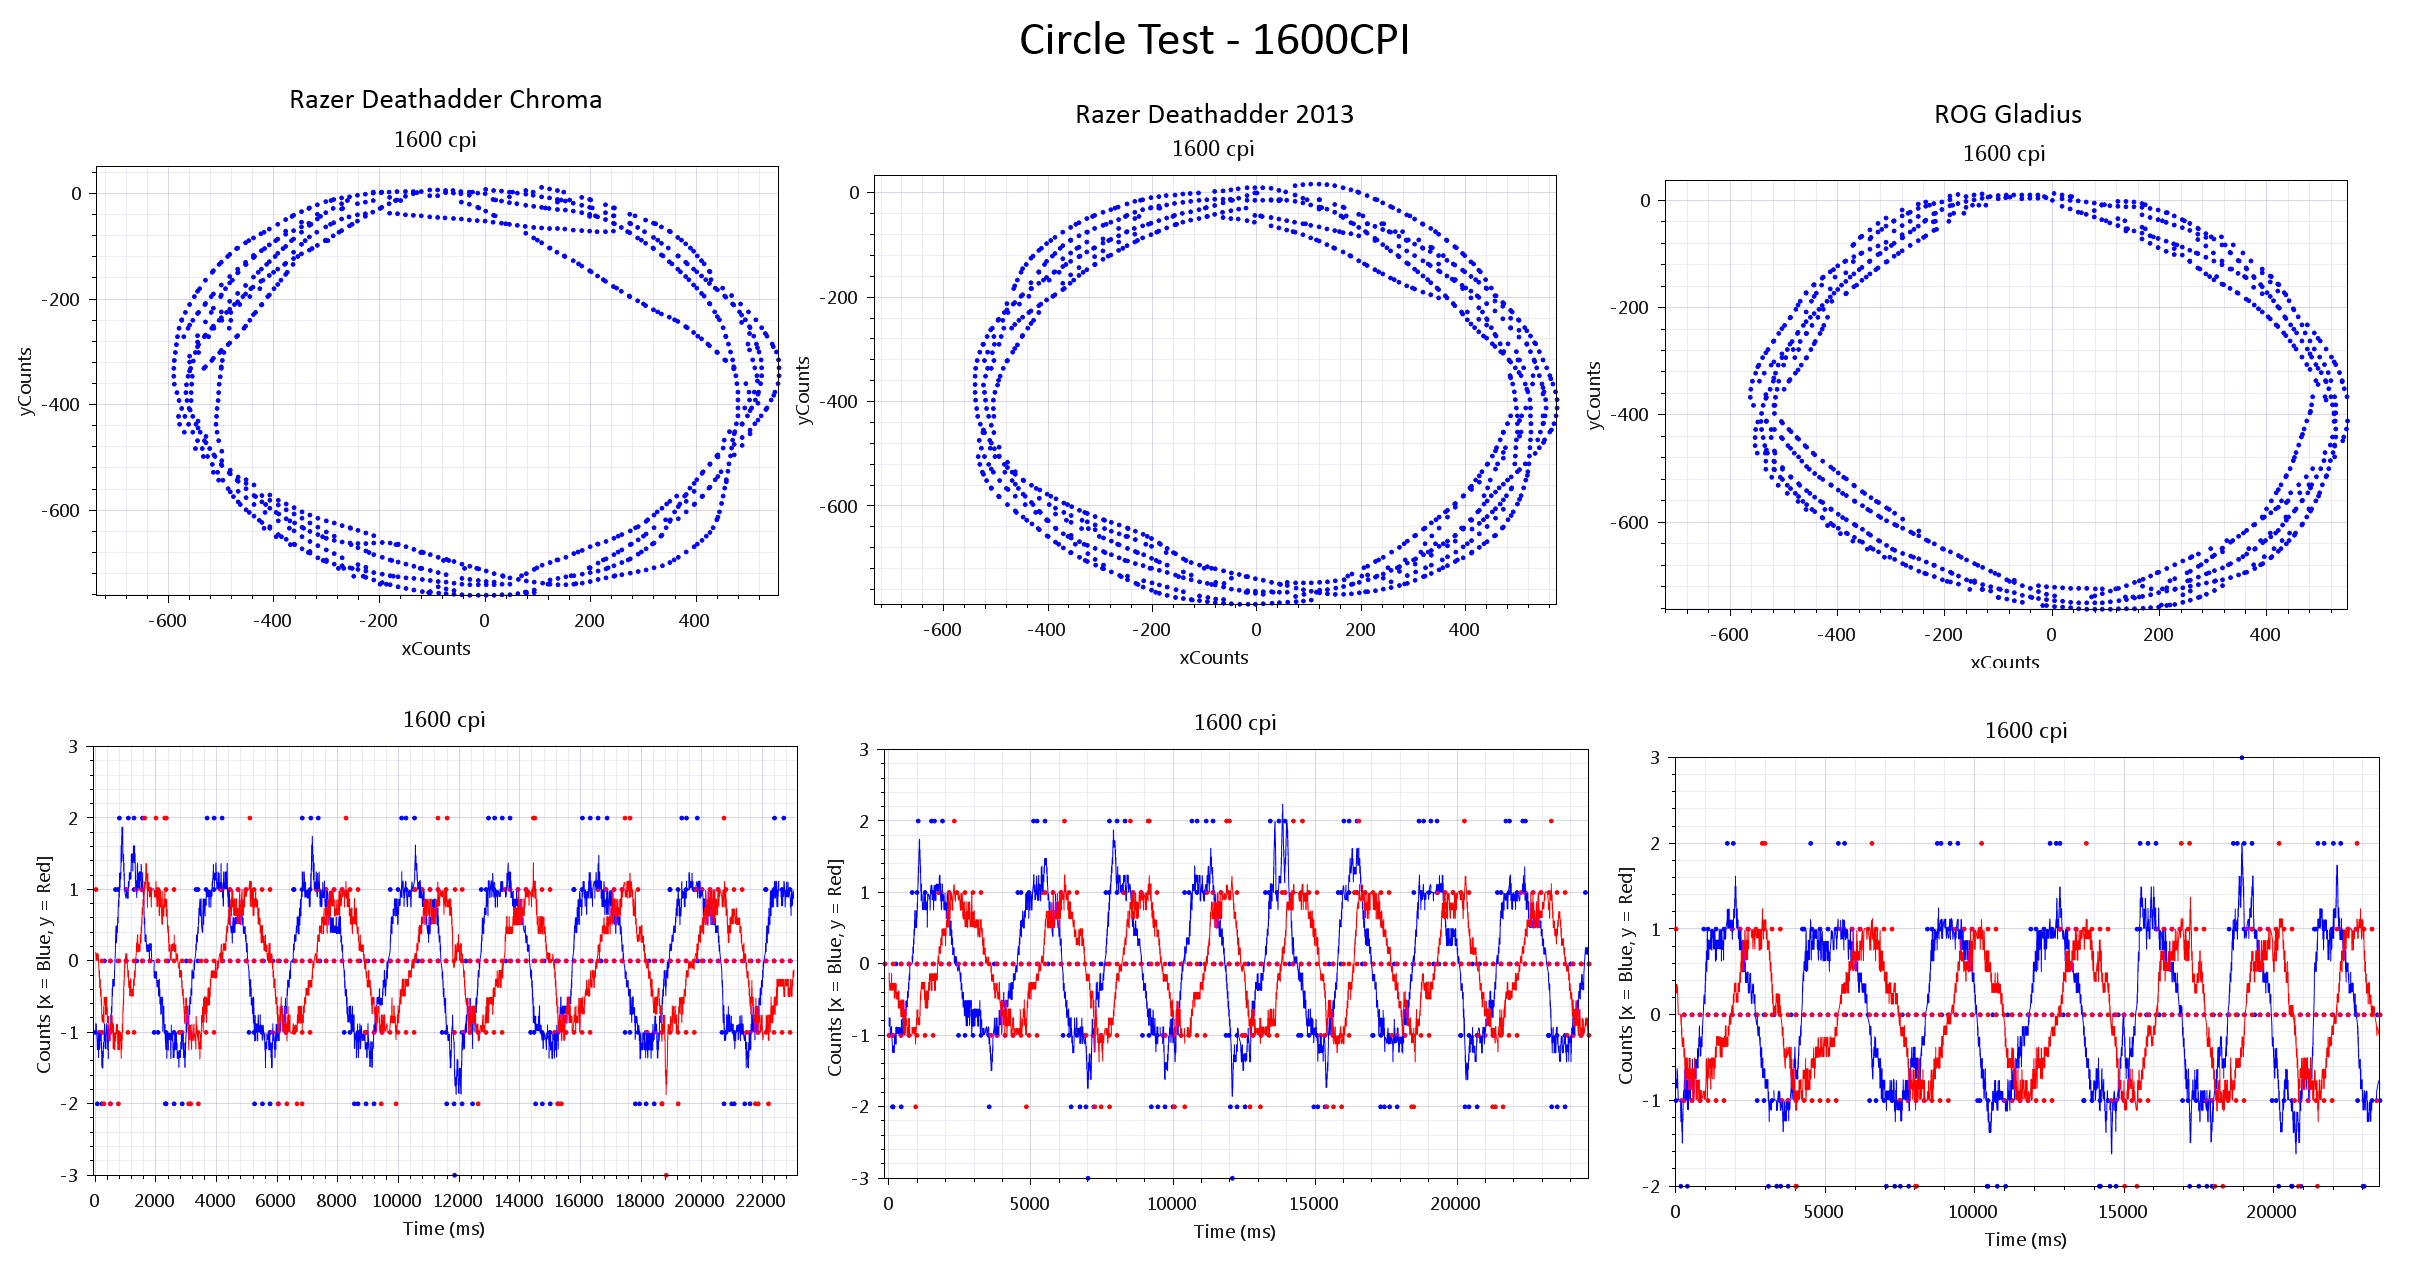
As in previous tests the Chroma seems to struggle to make the shapes we desire at lower CPI settings. Again we suspect this is due to the higher friction feet.
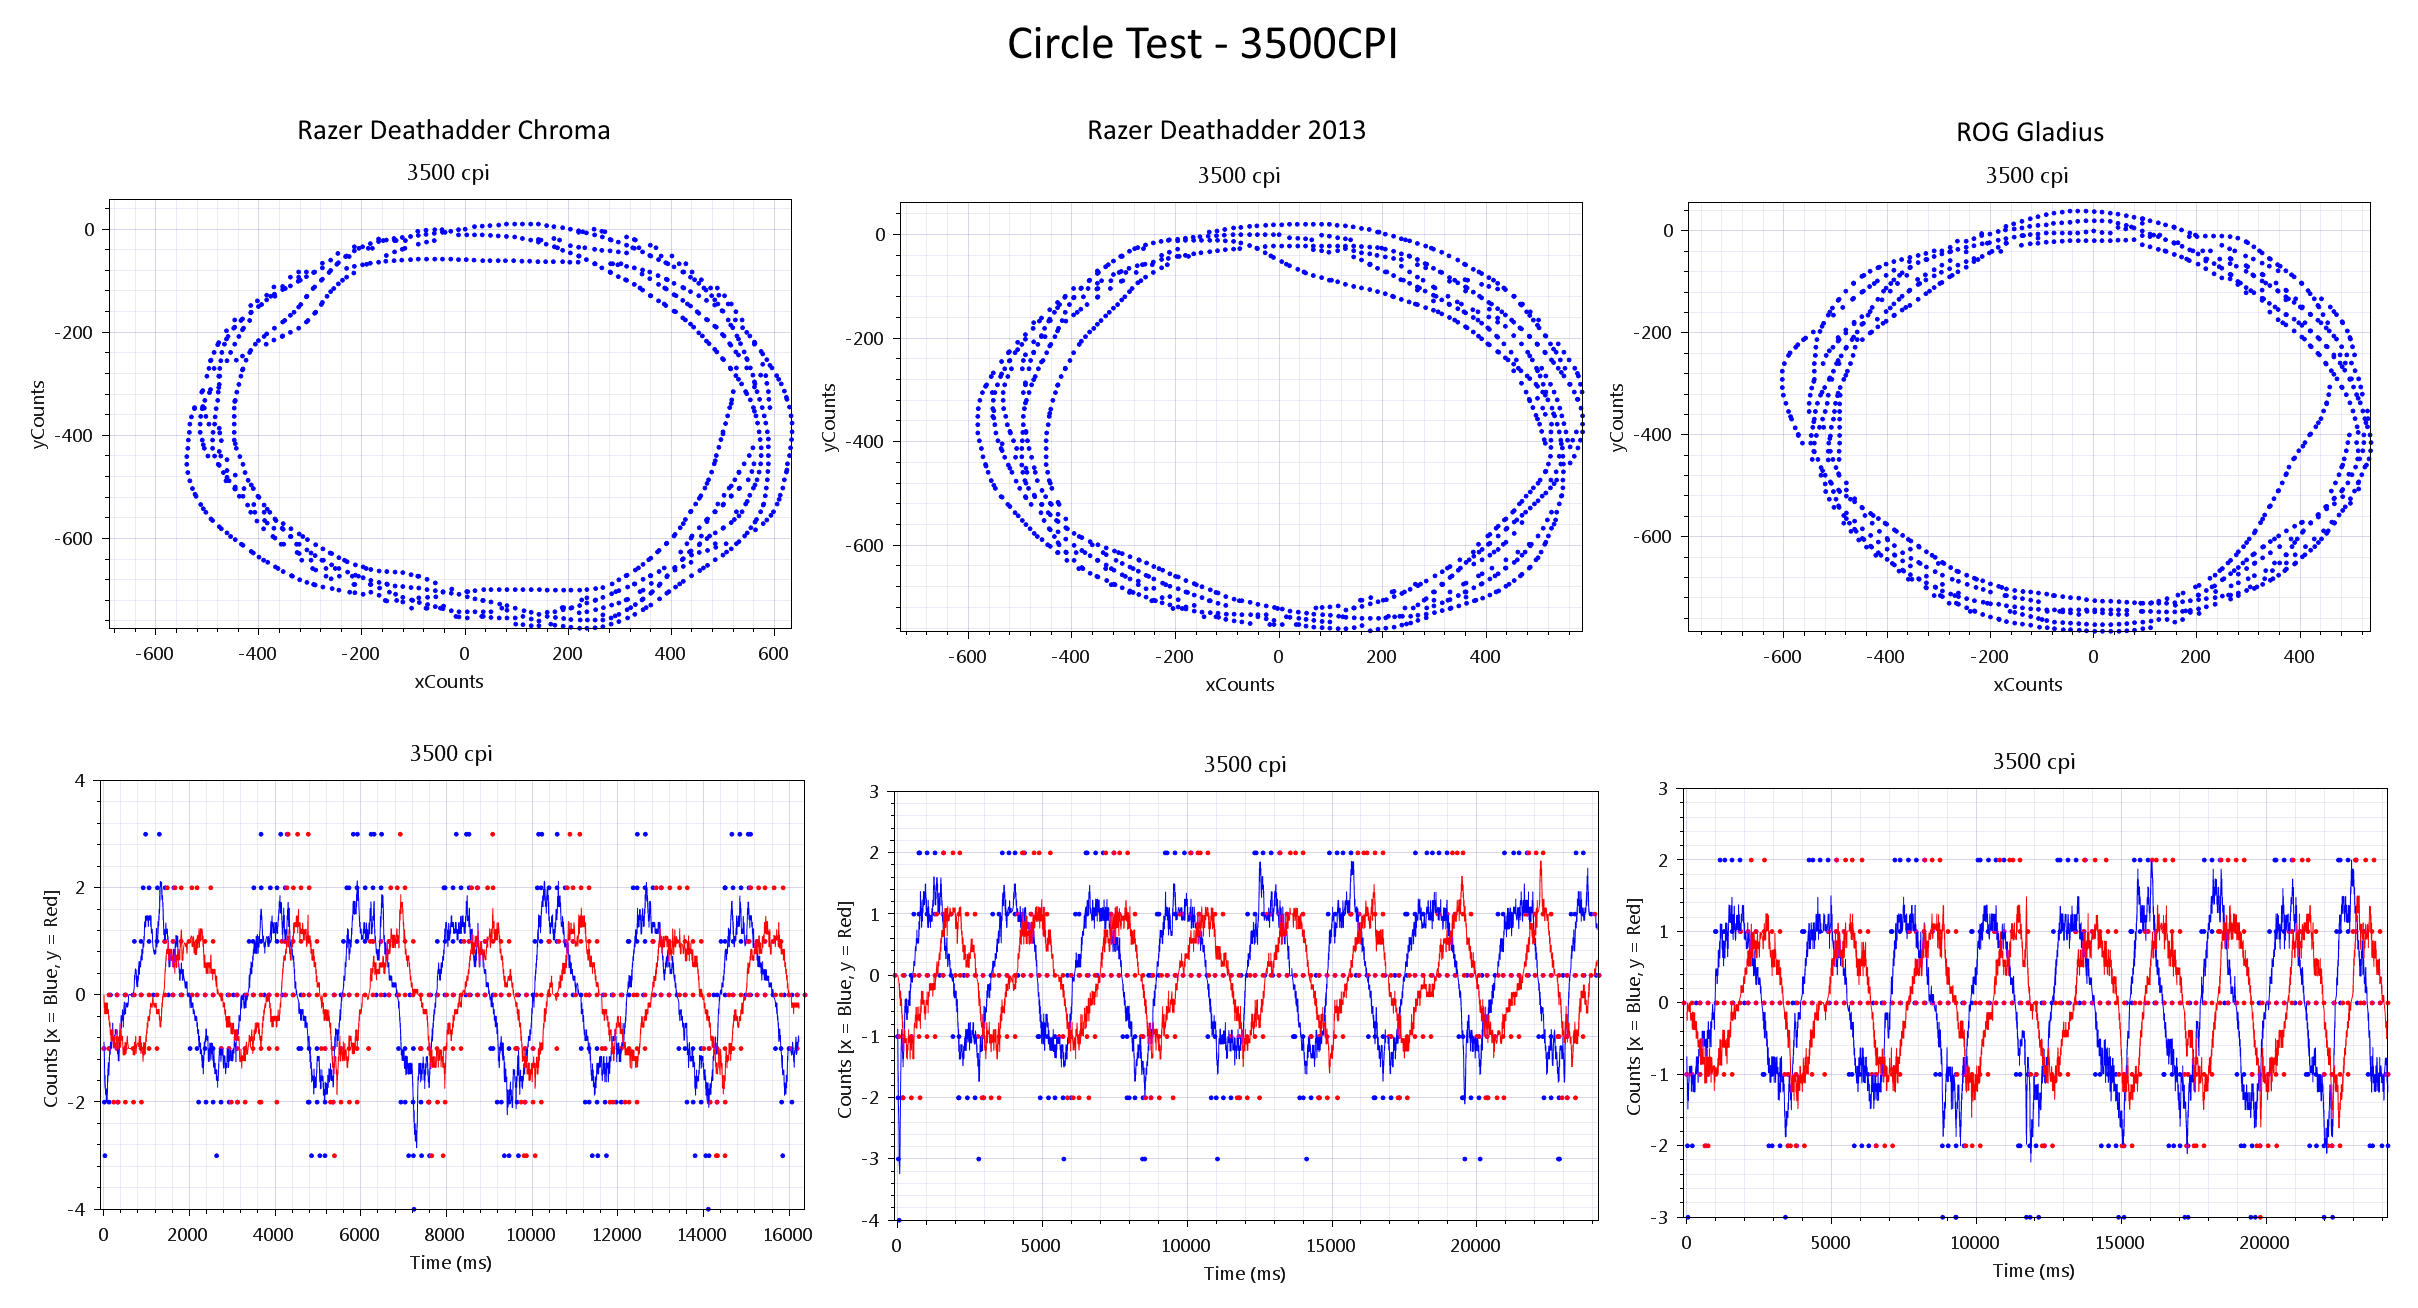
At 3500 CPI things are much the same.
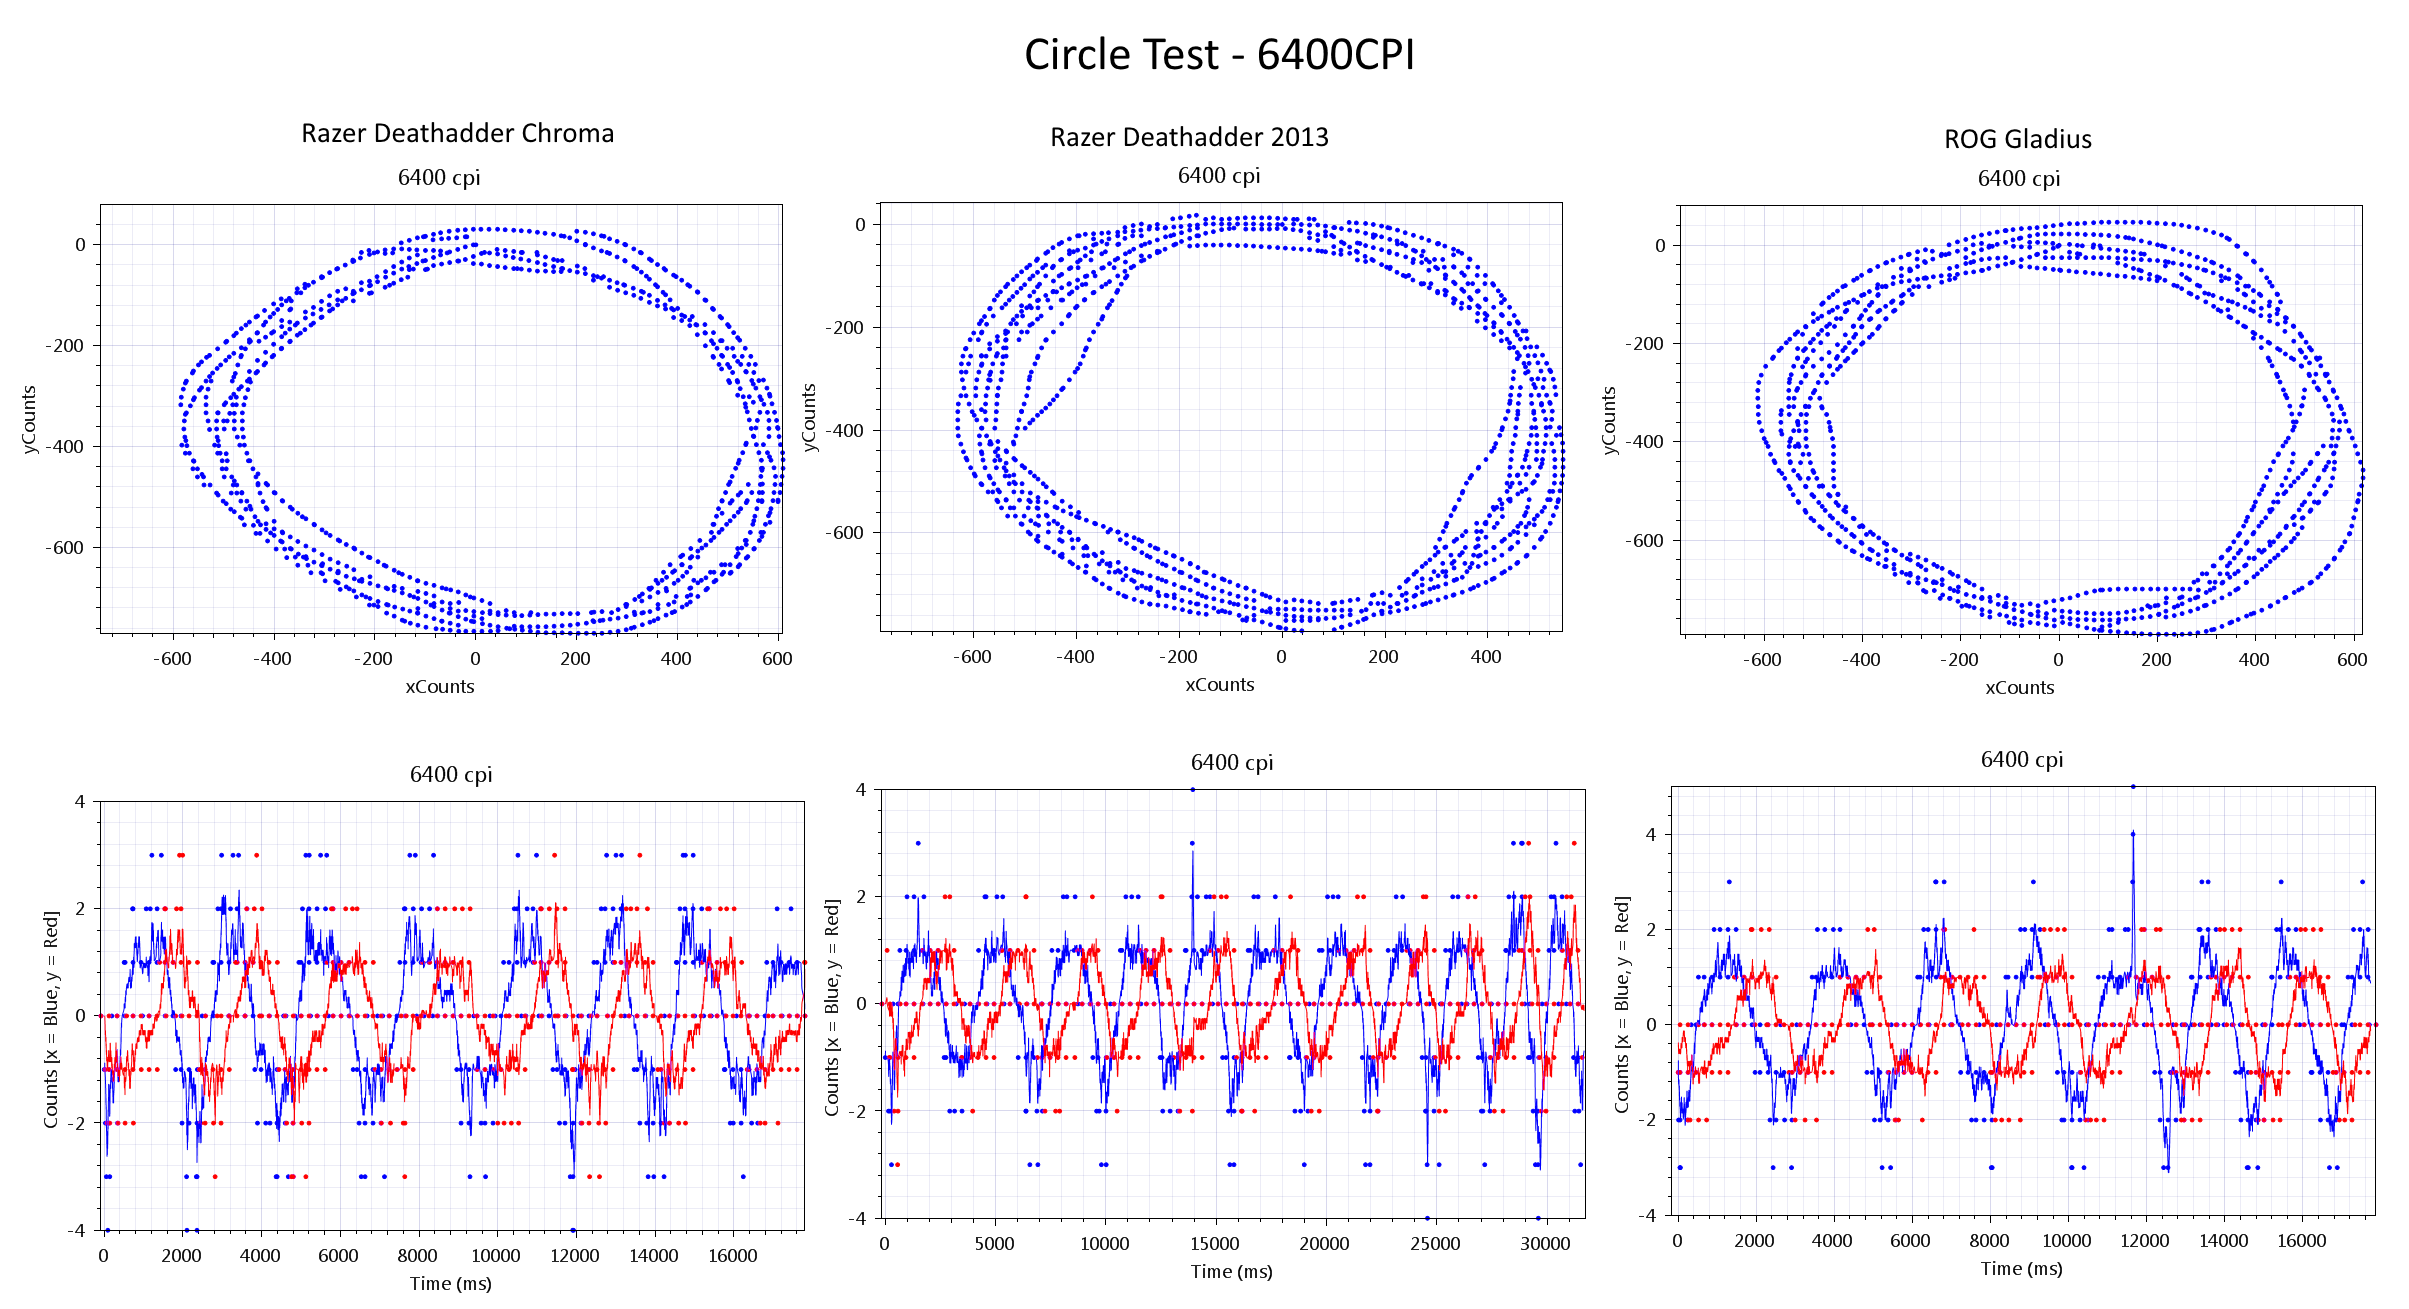
Again at 6400 CPI we see the Chroma start to look better while the 2013 and Gladius look a bit worse.
Lastly 10000 CPI:
Here we see the circle lose it’s “circleness” again. Perhaps this is due to the mouse, but at this point the circle being drawn is much smaller so any hand error is percentage wise much larger.
Hyperglide Feet
As noted the Razer stock feet aren’t perfect and the hyperglide feet do feel smoother. After testing was complete the mouse had it’s stock feet replaced with the hyperglides and I ran the swirl test again at higher CPI settings:
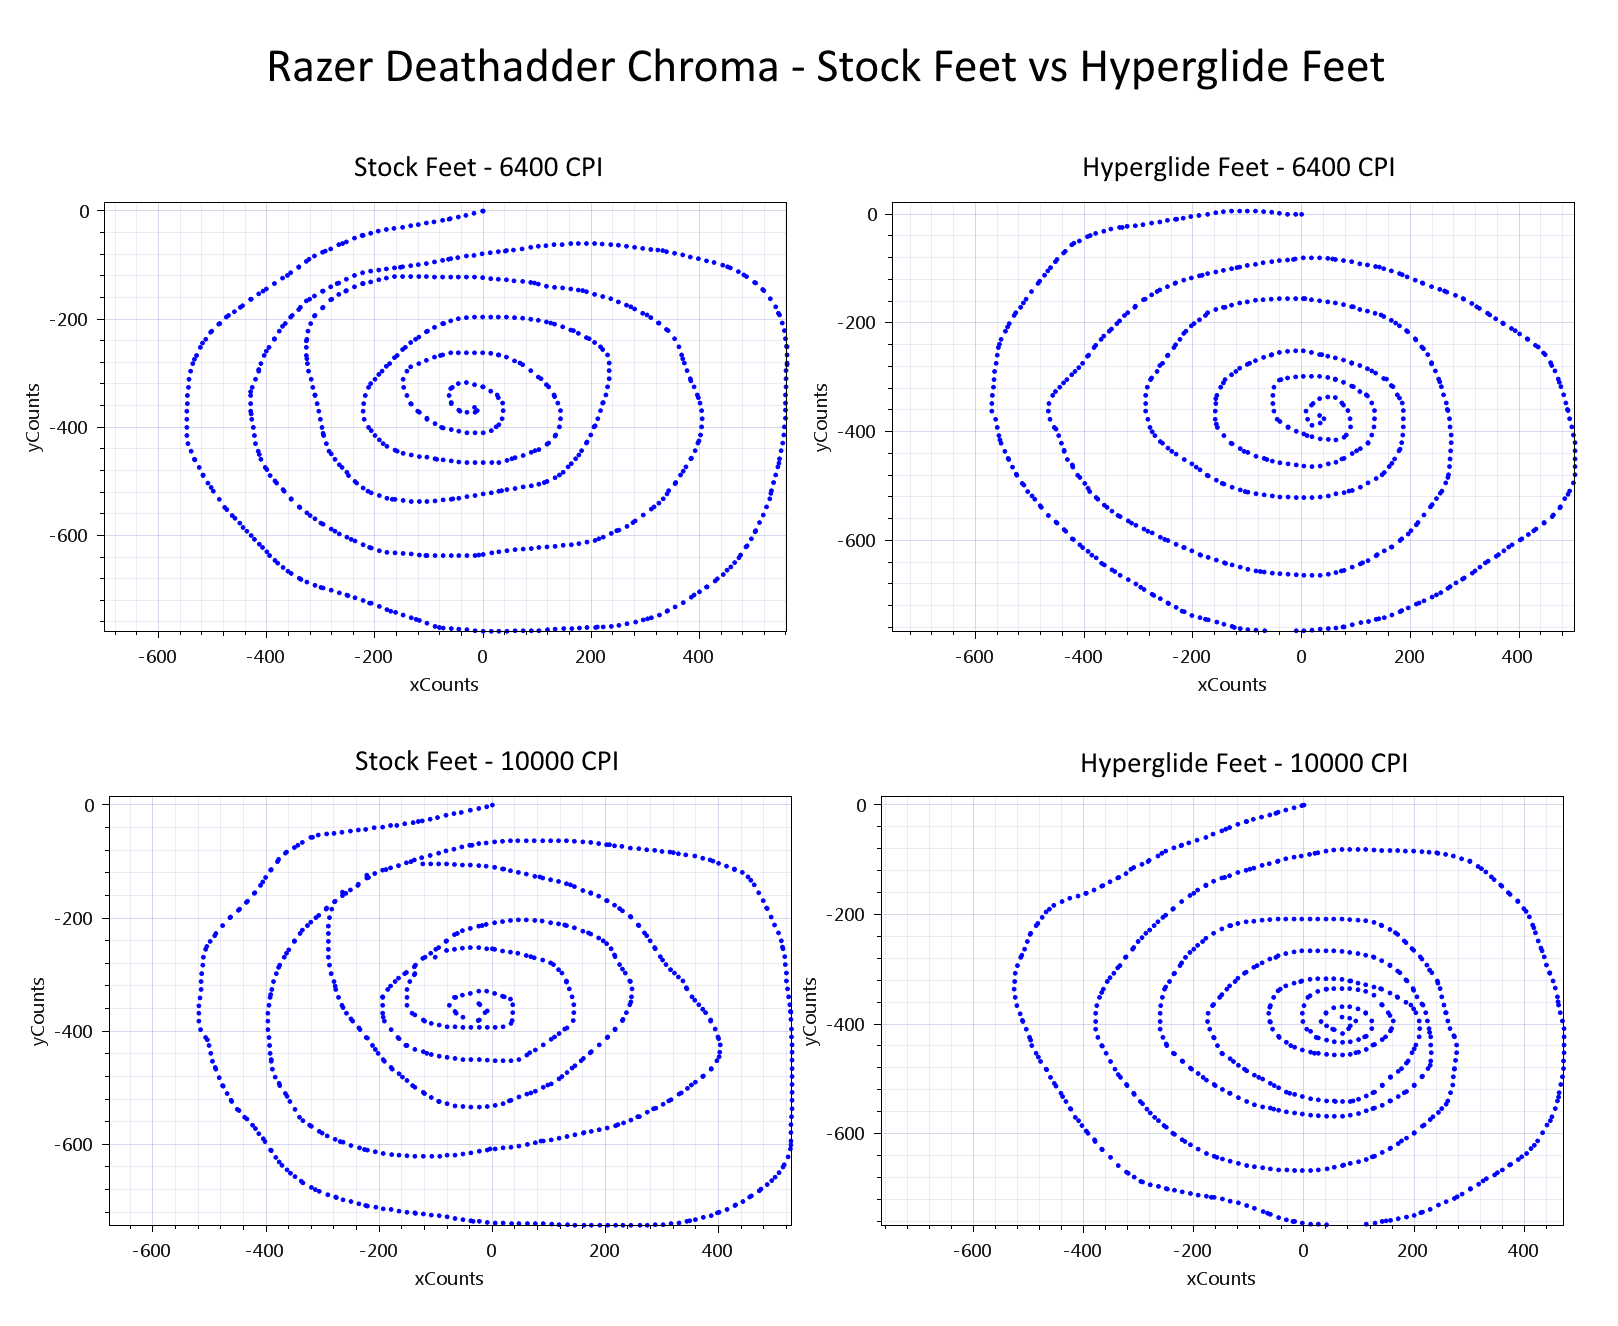
They hyperglides generally gave me “smoother” and more “circular” swirls than the stock feet and this gives credence to my subjective opinion that they felt “smoother” in use.


