


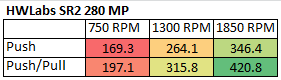
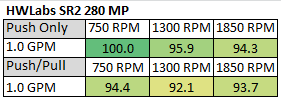
This first table shows the SR2 280 Mp’s Watts/10 Delta Temp numbers in a quick glance chart format.
Using this data we can effectively show percentage gains/losses relative to a reference point. It’s an interesting way to show gains/losses while changing a variable.
So, let’s focus on 1300 RPM as our reference and see how much gain or loss in performance we get by changing fan speed.
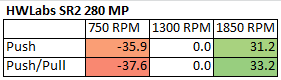
From these results we see a large drop in performance of from 1300 rpm to 750 rpm, more so in Push/Pull. The excellent increases from 1300 rpm to 1850 rpm were the 2nd best gains of the entire group and indicates some strong performance results were achieved using high speed fans.
So from the data above we’re getting a good idea of how the SR2 280 MP radiator performs relative to itself. But there is a large selection of 280mm radiator models to choose from, so let’s put the it’s results into some comparison charts.
Push Only Data vs Competition
In general, thicker radiators perform better than thinner radiators of the same size (fan capacity) but a lot also has to do with how each core has been designed / tuned; number of tubes, thickness of tubes, fin array etc. If it were thickness alone we should expect the SR2 280 MP to always be at the top of the rankings and our testing would be totally unnecessary.
Focusing on the Push Only results for now, let’s see how the SR2 280 MP’s performance compares to the competition.
Let’s start with 750 RPM.
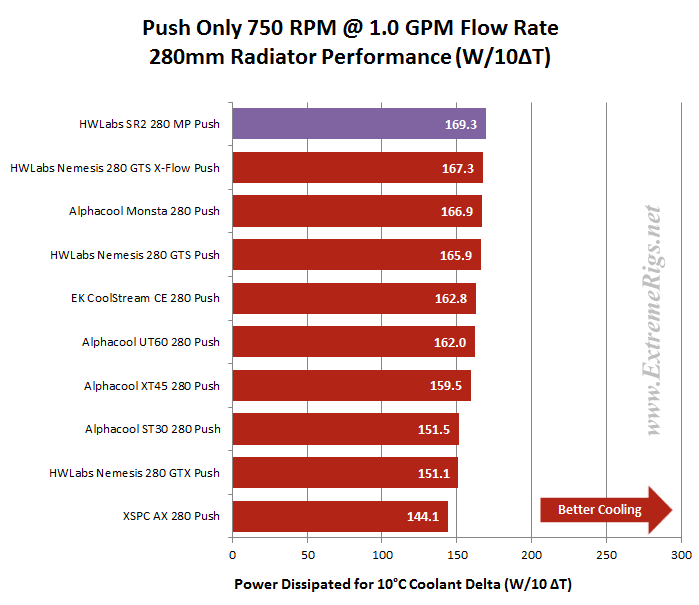
First data point and it’s straight to the top for the SR2 280 MP. It’s almost a surprising result given how thick it is. Apart from the low FPI I believe the thick tube design and resulting flow through each tube is working in it’s favor here. Whatever the reason, there seems no doubt that the SR2 is capable of continuing the legacy of it’s predecessor for fantastic performance with low fan speeds.
Now let’s look at 1300 rpm:
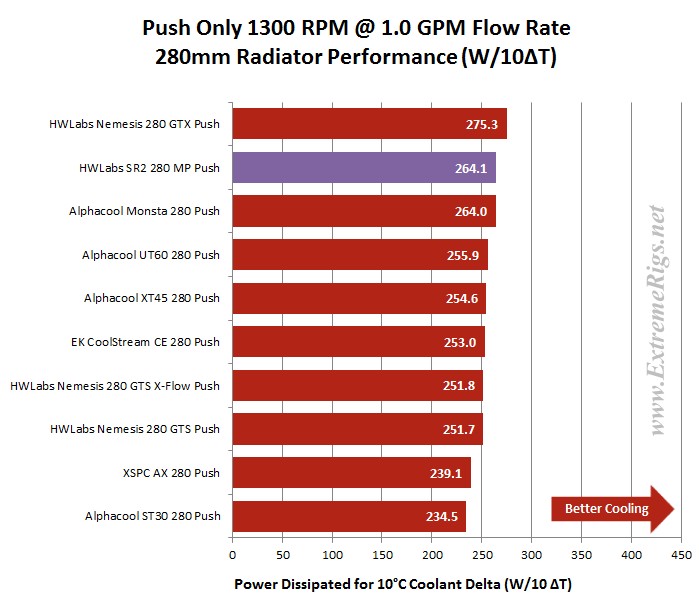 Taking out equal second place, this is another fantastic result for the SR2 280 MP. The four thick radiators of the test group now occupy the top four spots.
Now 1850 rpm Push Only:
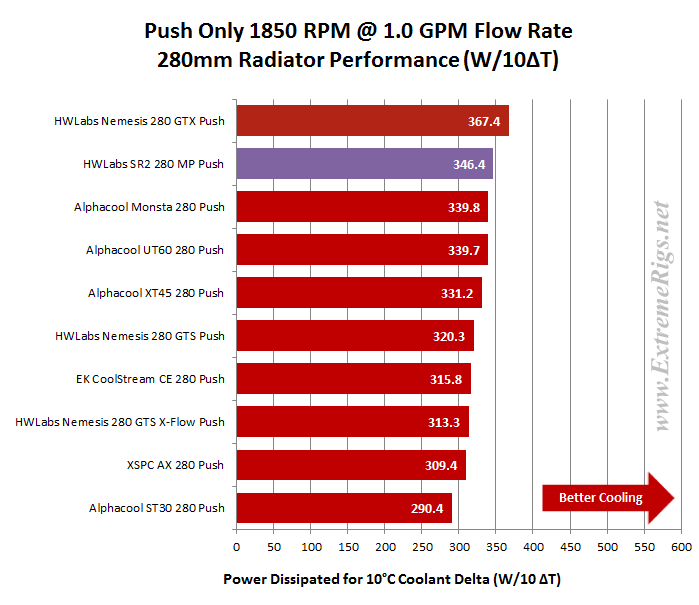 At 1850 rpm the SR2 280 MP again takes 2nd place and is ~6% ahead behind it’s stable mate. What an impressive turn out for HWLabs, taking 1st and 2nd place in each of the Push Only tests we conducted and the SR2 280 MP featured in all 3 of those results. NICE!
Let’s find out how the SR2 280 MP performs with Push/Pull fans.
Push/Pull Data vs. Competition
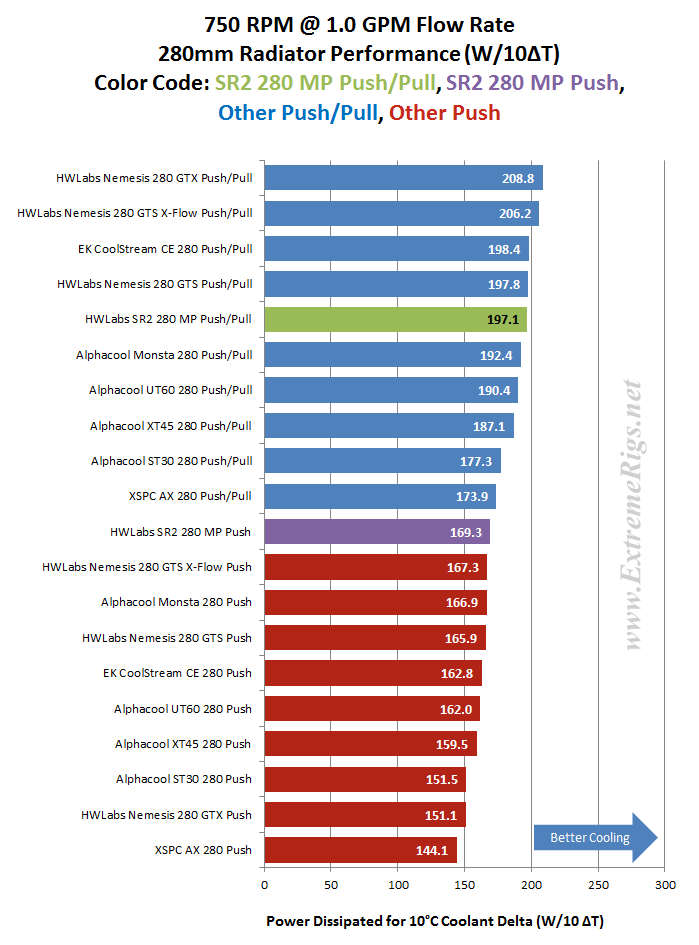
Firstly the 750 rpm:
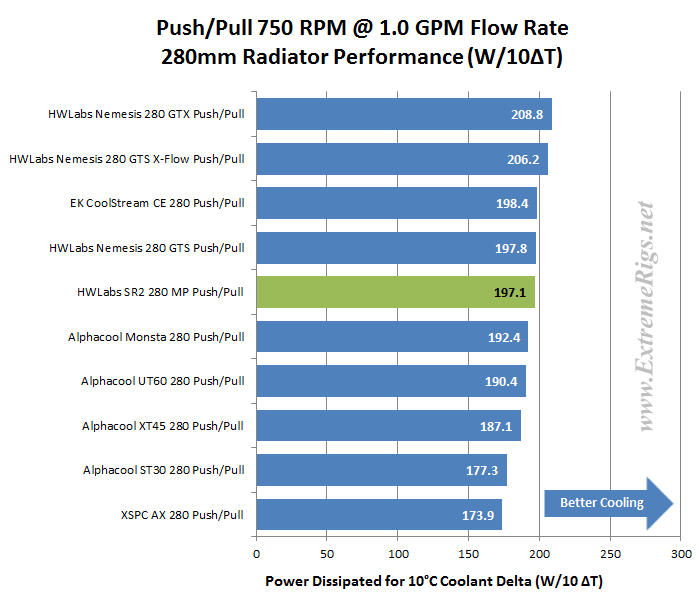 While the thick and dense Nemesis GTX placed first it was a bunch of thinner rads which knocked the SR2 280 MP down a few rungs at this data point. Impressively 4 out of the top 5 positions are held by various HWLabs models and all with ~6% of each other.
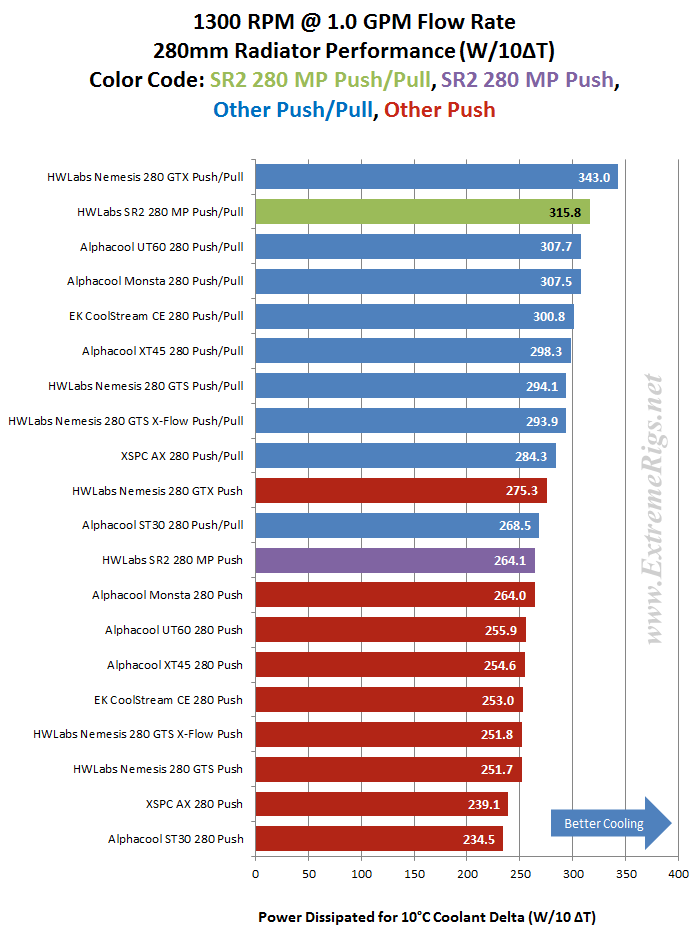
Let’s move to 1300 rpm:
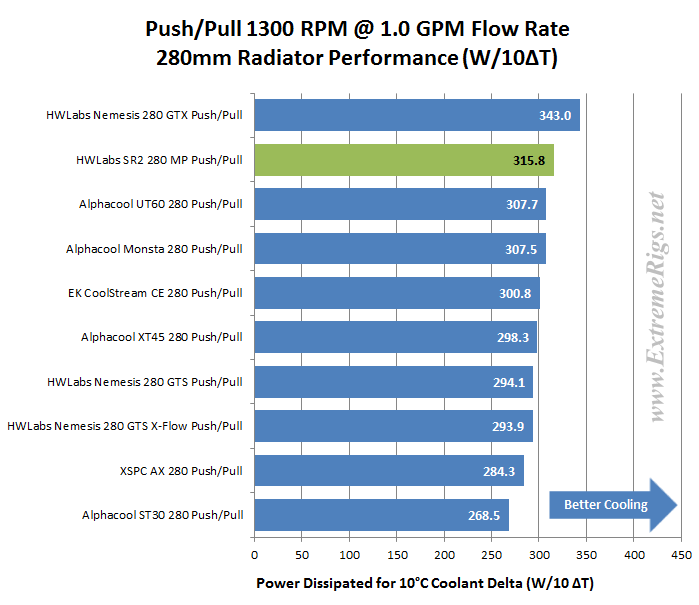 At this data point the Nemesis GTX continues it’s streak of 1st places and now has a clear performance advantage over the SR2 280 MP which moves back up to reclaim 2nd place.
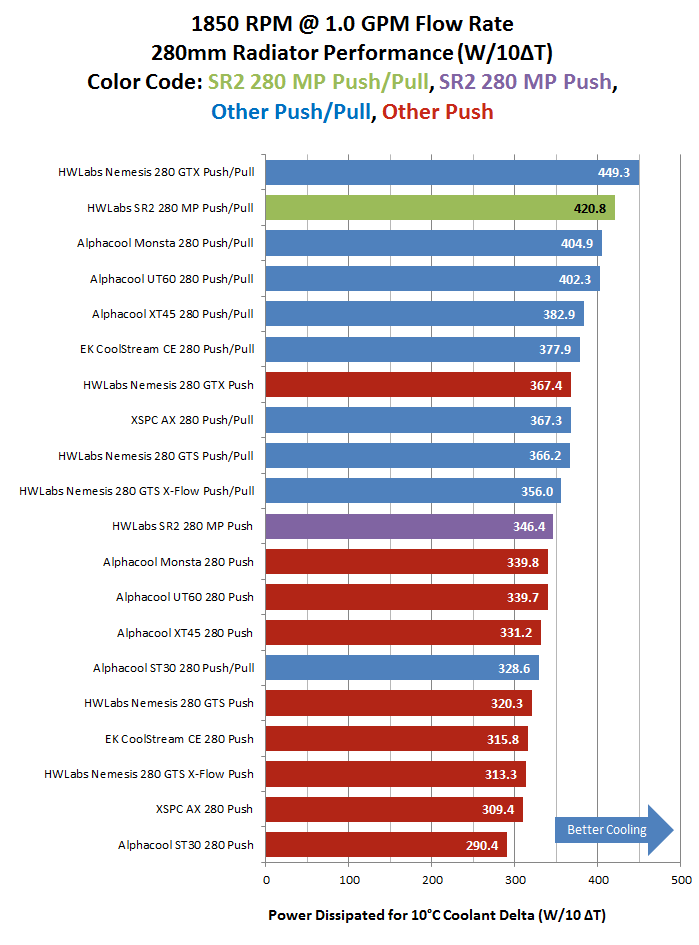
Now 1850 rpm:
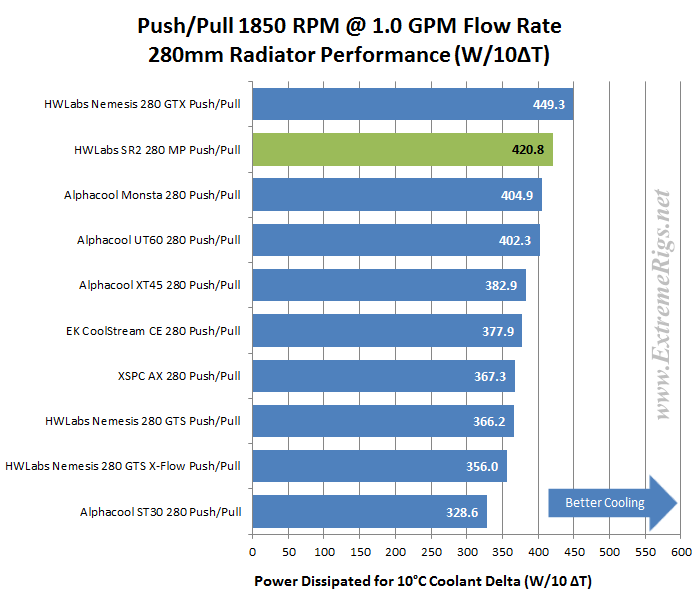 At 1850 rpm Push/Pull the SR2 280 MP has a another 2nd place result and is well clear of the 3rd place radiator. I think it’s a safe call by now to say the SR2 280 MP is capable of excellent performance with high speed fans as well as low speed.
Let’s now combine the Push Only and Push/Pull results of our 1.0 GPM flow rate tests into one plot for each fan speed. Sometimes these combined plots show up some points of interest. This time however the low and medium speed plots did not show up anything interesting so we have “spoilered” them so readers who enjoy these plots can still see the data.
In the 1850 rpm combined we see perhaps the only interesting result concerning the SR2 280 MP. It was one of 5 radiators which had a better Push Only result than the slim ST30’s Push/Pull result.
We’ll leave you to do some maths and figure out the difference in thickness and which has better value Vs. performance when factoring the price difference of the radiators and cost of your selected fans.
Another view of the same data, this time plotted as curves and some extrapolation added.
Be warned these plots can be hard to read given that many results are similar at the same data points.
Again the Push Only data first:
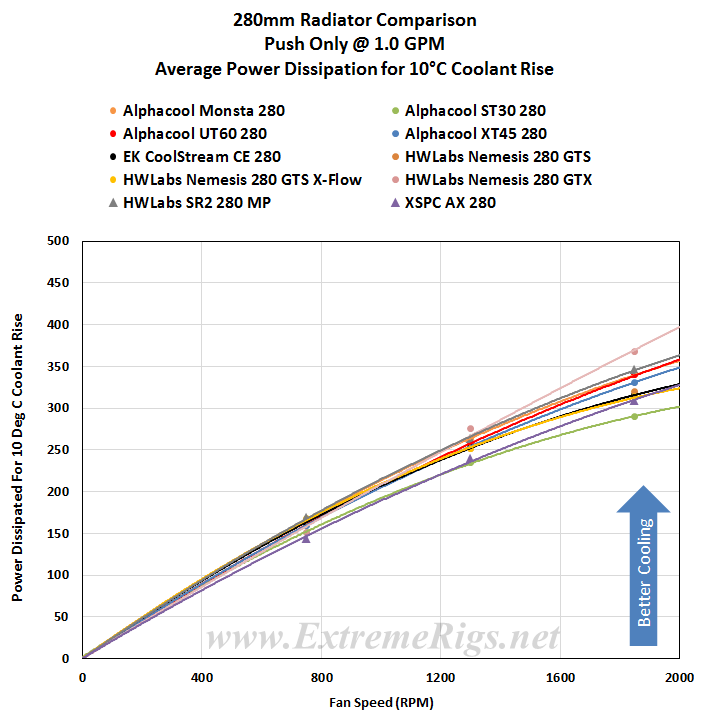 This perhaps best shows just how close the results are, particularly with low speed fans.
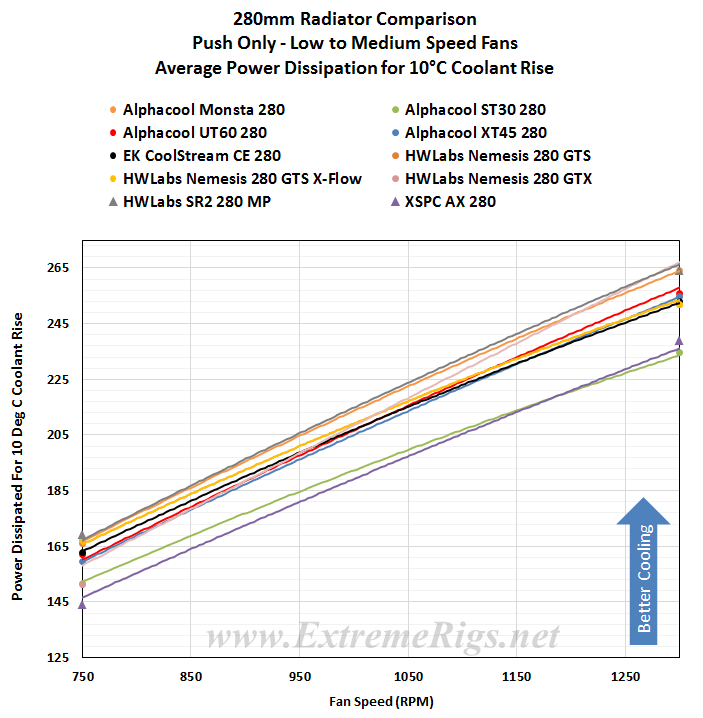
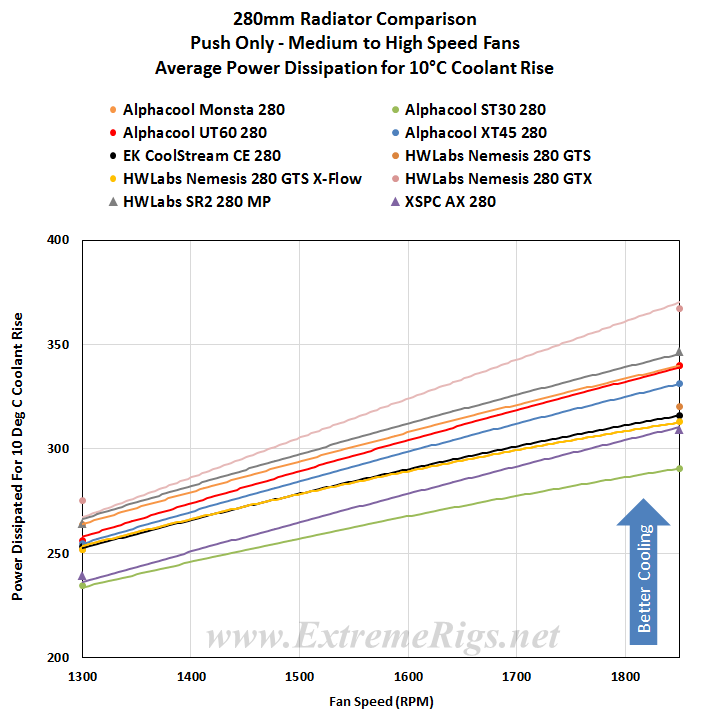
Because the data curves in plot above are almost blurred into one another, we have split it into two separate plots; 750 rpm to 1300 rpm and 1300 rpm to 1850rpm and zoomed in on those fan speed zones.
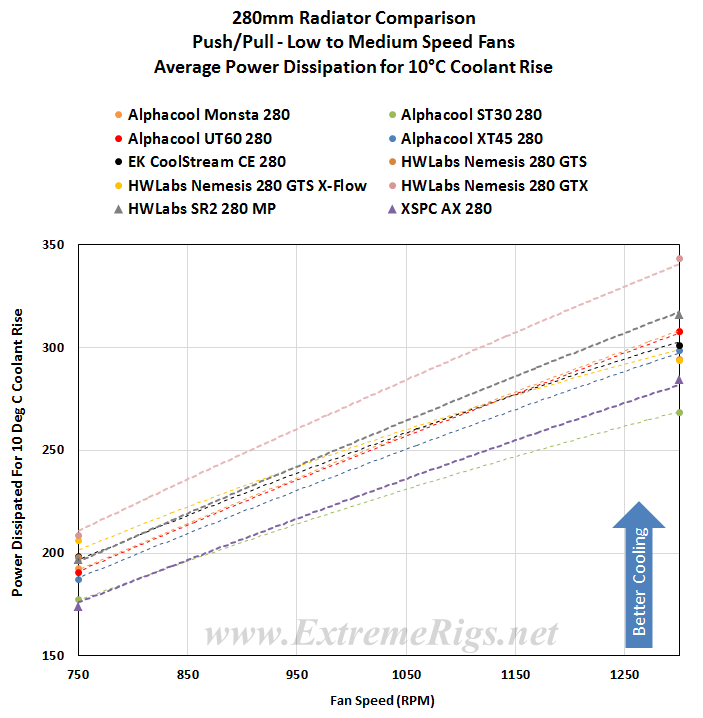
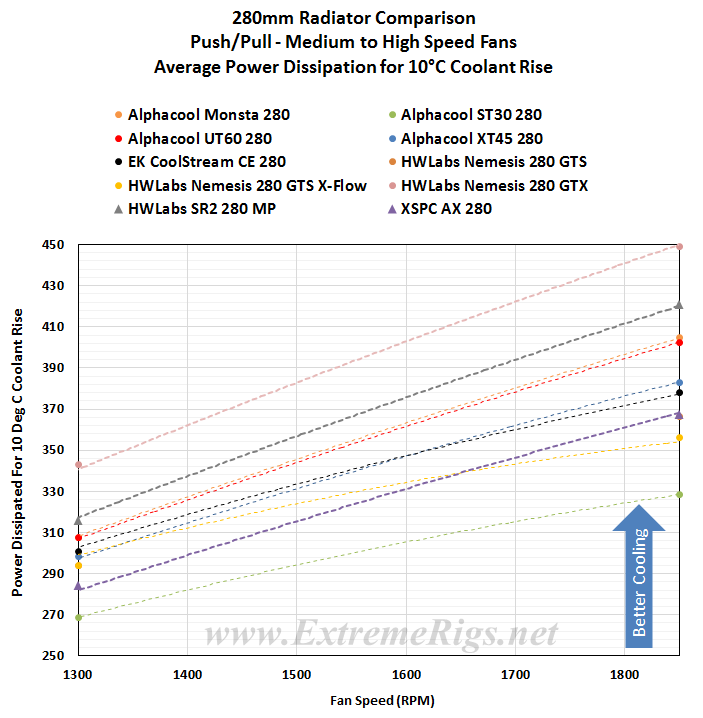
Now the Push/Pull results are plotted, again followed by split and zoomed versions.
Average Performance Factors
For every radiator tested we create APF “Average Performance Factor” charts from both the Push Only and Push/Pull results. We also make a combined plot of the average called the “Master Performance Factor”. The radiator with the best cooling ability (W/10ΔT) at each rpm is awarded a score of 100 and every other radiators W/10ΔT result is scored as percentage of the top performer.
This way of looking at the comparison takes away any advantages that a radiator may have at higher or lower fan speeds and looks at an overall average. While this appears fair it does tend to favor those radiators that are all-rounders and those radiators which do very well at high RPM. Most users should be more focused on their specific use case.
Here are the SR2 280 MP’s percentage scores at each data point:
 What a fantastic set of results this is for the SR2 280 MP. When we see all comparison results over 90% it is a sure sign that the radiator has very good all round performance. It was in fact the only radiator in the test group which achieved all it’s comparison results over 90%. Bear in mind that without the Nemesis GTX to compare to, the SR2 would have had a lot more 100% results in that table!
The percentage numbers in the table above offer another way of looking at the SR2 280 MP’s results. But for our scoring system we need a way to reduce the categories while retaining the data. To do this we average the results for each fan assembly type giving us Averaged Performance Factors. We calculate this for Push Only, Push/Pull and finally an average of everything.
Firstly – the Push Only APF:
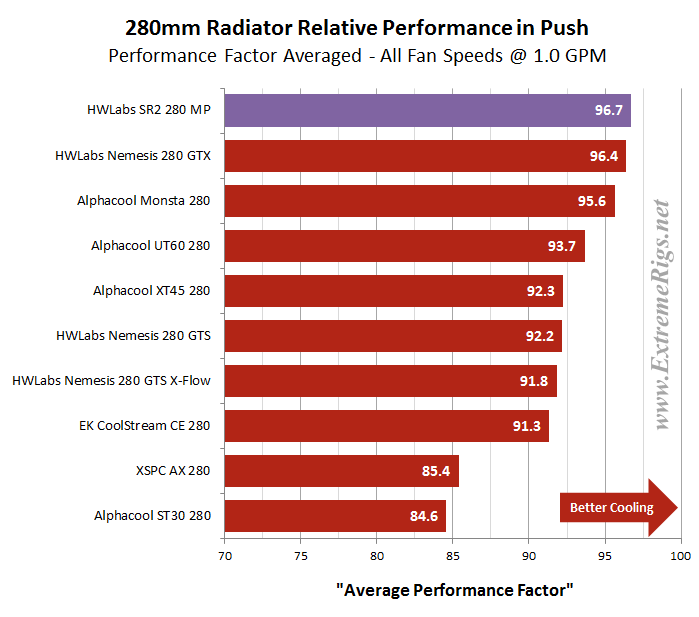 With an 96.7 % Averaged Push Only result the SR2 280 MP places equal 1st (after test error margin is factored in) with it’s Nemesis GTX stablemate. The 1st place and 2nd places in Push Only at all fans speeds demonstrates great performance.
Now the Push/Pull APF:
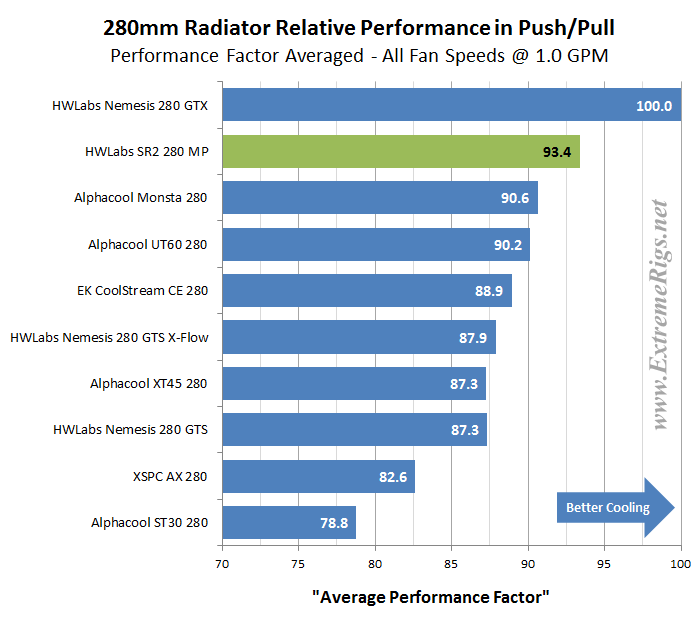 Nothing was able to beat the Nemesis 280 GTX with a Push/Pull fan assembly. The SR2 280 MP took 2nd place by a clear margin or the next ranking radiator.
Finally we created the Master Performance Factor which is calculated from the averaged results of all the Push Only and Push/Pull thermal tests, at all fan speeds.
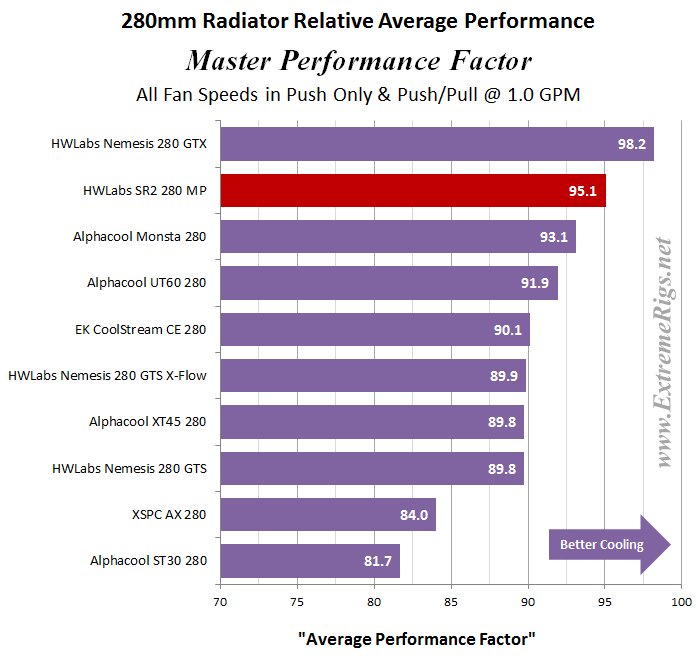 The MPF score of 95.1 lands the SR2 280 MP in second place and is clear evidence that it is able to perform extremely well with any fan assembly and speed setting.
Space Efficiency
The SR2 280 MP’s space efficiency vs. performance ranking is not likely to be very good as thinner radiators almost always produce better results here than their thicker counterparts. We have used the Average Performance Factor results from the charts above to compile two plots which shows us how it compares to the other rads in terms of performance Vs. space taken.
First up is Radiator Thickness Vs. APF
Here the combined APF scores were divided by the radiator thickness only, with the highest (most space efficient) issued a score of 100. Each of the other radiators results was converted to a percentage of the most space efficient radiator’s score.
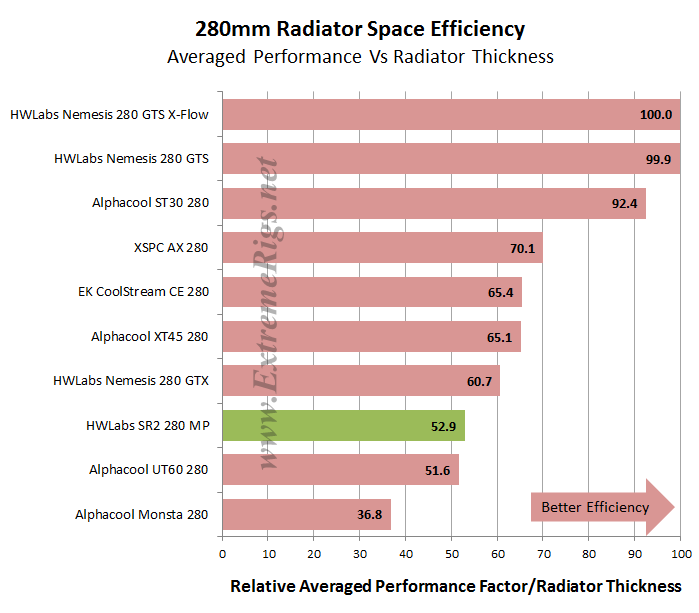 The order has ended almost in order of thinnest to thickest and as anticipated the SR2 280 MP did not fair so well in this assessment.
Next we took the APF results for Push/Pull and divided it by the total thickness including the fans and applied the same scoring system. For the Push Only we used the Push Only Vs Push/Pull comparative results and applied the same scoring system when compared against the Push/Pull. This plot is likely the most useful of the 2 plots for space efficiency.
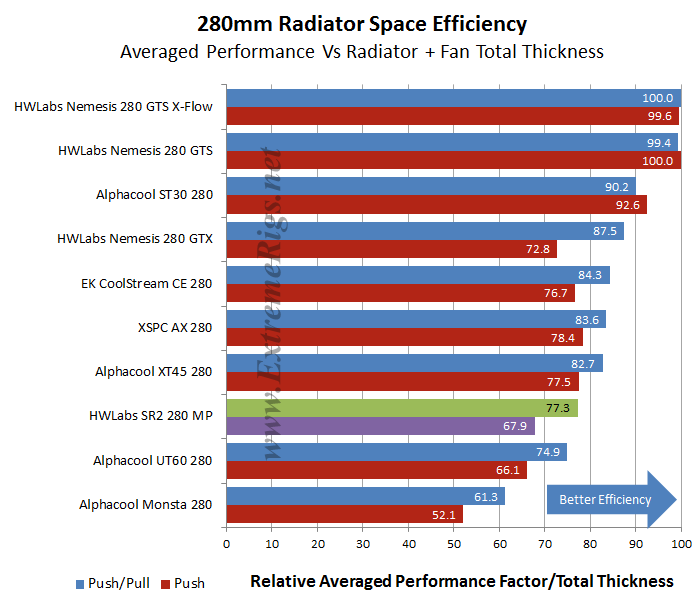 The results here again are almost in order of thickness and as expected the SR2 280 MP did not score very well.
Value Factor
While our APF’s are still fresh in mind, let’s now look at some Performance vs Price results to show which of the 280mm radiators might offer the best bang for your buck. Each radiator’s combined APF scores were divided by the radiator cost and again we applied our scoring system of percentage Vs. the best performer of the category.
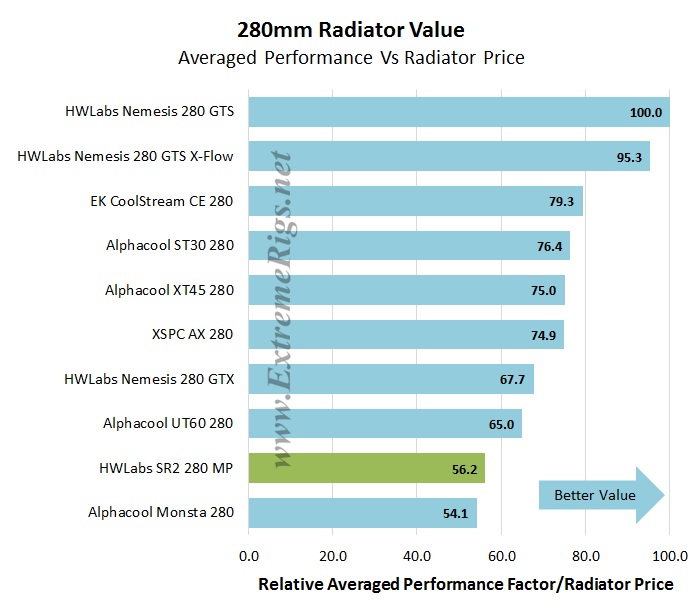 The SR2 280 MP’s Value Factor turns out to be very low. This tells us that it does not offer outstanding value for the performance potential it offers. It is the most expensive of the test group which did not help it’s ranking. In reality the difference is not great, but when visualizing with percentages as we have done, the differences appear large.
Generally value and space efficiency metrics usually correlate – thicker radiators do contain more material afterall and so are usually also more expensive. Once we factor thickness in, we realize that all the radiators that are better value are actually thinner.
Next Up – Summary!
![]()


Are the numbers the same for the non MP two port version??
Thanks
They should be as the core is the same. The restriction may change slightly depending on the ports used I suppose.
Comments are closed.