


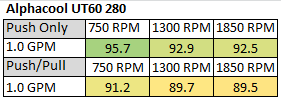
This first table shows the UT60 280’s Watts/10 Delta Temp numbers in a quick glance chart format.
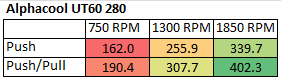
Using this data we can effectively show percentage gains/losses relative to a reference point. It’s an interesting way to show gains/losses while changing a variable.
So, let’s focus on 1300 RPM as our reference and see how much gain or loss in performance we get by changing fan speed.
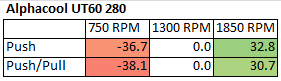
From these results we see a ~37% drop in performance of from 1300rpm to 750 in both Push Only and Push/Pull, however there is a good performance increase of ~32% with the next fan speed increase.
This indicates the UT60 280 is likely best tuned for medium speed fans, with a slight bias towards higher speeds than lower speed fans. This makes sense when we consider it’s thickness, despite having a low FPI count.
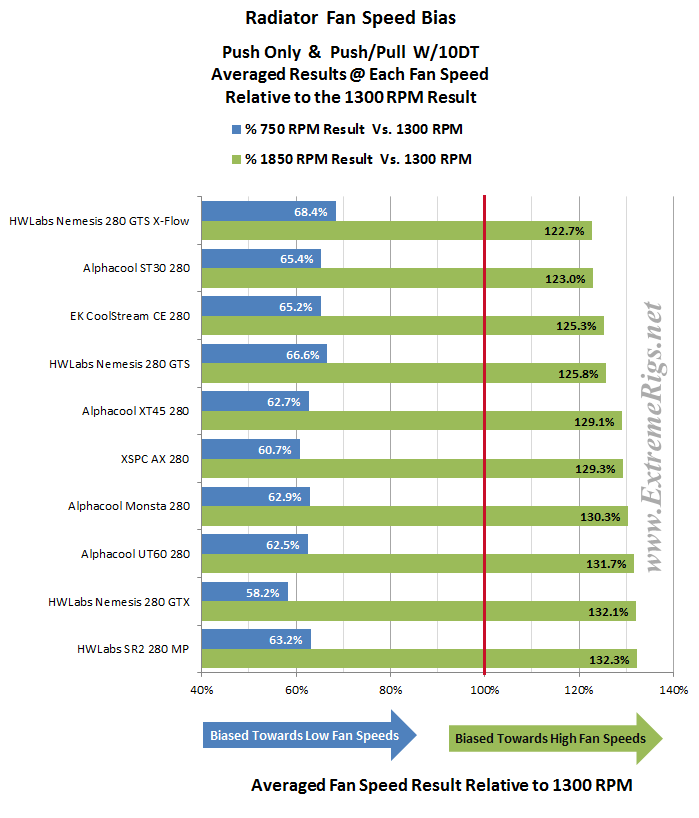
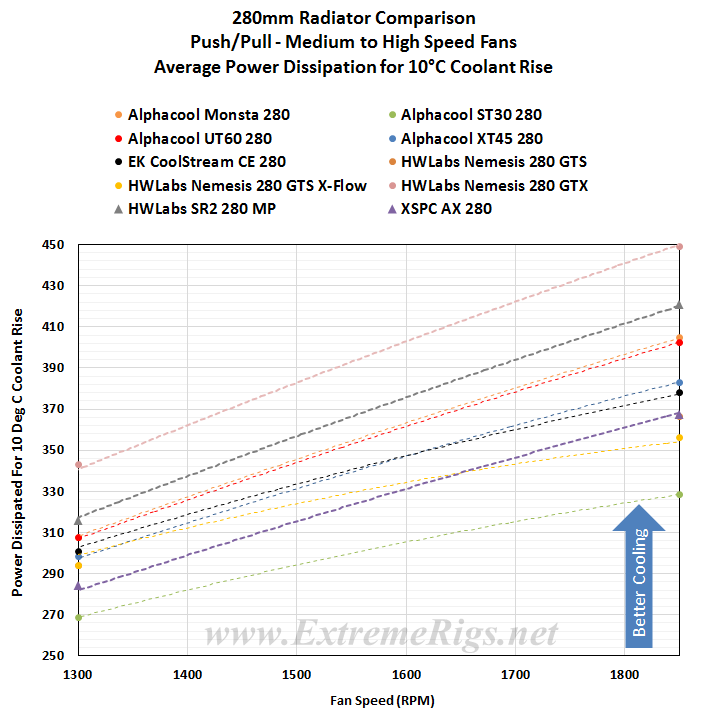
Recently I’ve been talking more and more about fan speed bias and felt that it was not adequately being represented visually. So we’ve come up with a new plot which maybe better shows fan speed performance bias.
The following plot is not a radiator Vs. radiator comparison, although all the 280 models tested are included and ordered for high speed results. Rather it is intended to show the bias of each individual radiator by averaging the Push Only and Push/Pull W/10DT results and comparing the result as as percentage to the 1300 rpm result. The averaged 1300 rpm calculation was used as the base-line and is set at 100%.
Or put more simply, how did each radiator’s 750 rpm and 1850 rpm results compare to it’s 1300 rpm.
 So from the data above we’re getting a good idea of how the UT60 280 radiator performs relative to itself. But there is a large selection of 280mm radiator models to choose from, so let’s put the UT60 280’s results into some performance comparison charts.
Push Only Data vs Competition
In general, thicker radiators perform better than thinner radiators of the same size (fan capacity) but a lot also has to do with how each core has been designed / tuned; number of tubes, thickness of tubes, fin array etc. If it were thickness alone we should expect the UT60 280 to always be near the top of the charts and our testing would be totally unnecessary.
Focusing on the Push Only results for now, let’s see how the UT60 280’s performance compares to the competition.
Let’s start with 750 RPM results:
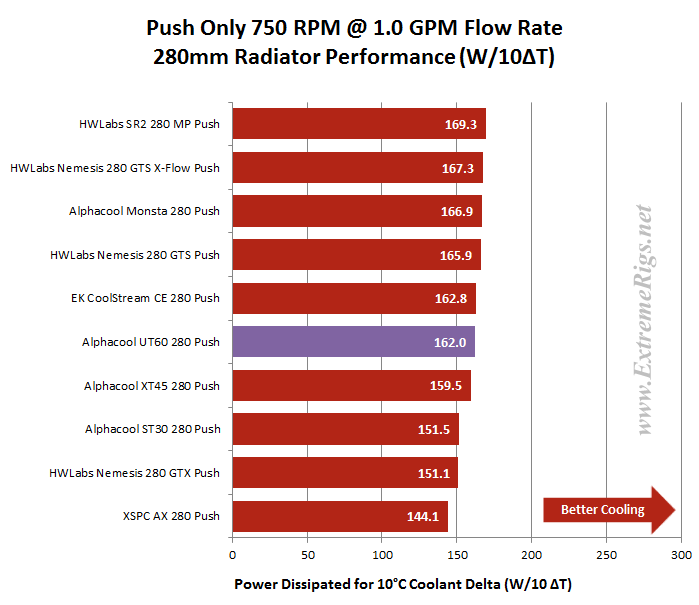
The results at this data point are always very close and the top 5 rads are a very mixed bunch of thickness and FPI indeed! After margin for test error is taken into consideration the UT60 280 places equal 5th and is only~4.5% behind the winner.
Something I found interesting here was that the 4 Alphacool models finished in order of thickness. This is something I wasn’t quite expecting. I wrongly assumed that lower fans speeds would not move enough air to make the Monsta more efficient than the UT60 OR that the UT60 would be better than the XT45.
Now let’s look at 1300 rpm:
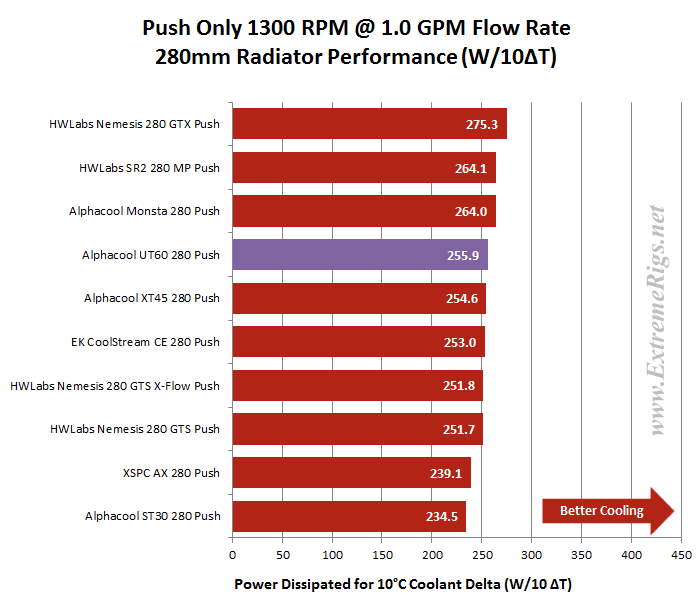 At Push Only 1300 RPM the UT60 280 improves in the rankings to finish in 4th place and was ~7% behind the winner. Again the Alphacool models rank in order of thickness with the XT45 nipping at the UT60’s heels.
Now 1850 rpm Push Only:
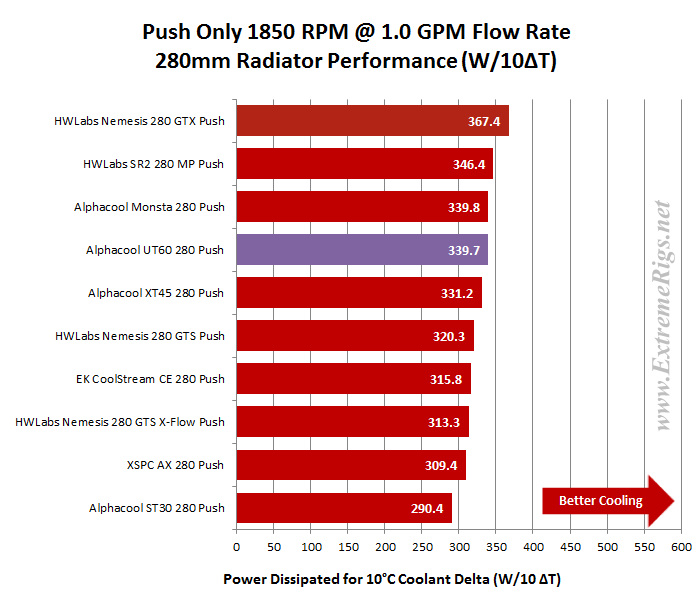 At 1850 rpm the UT60 280 claims an equal 3rd position (with it’s fatter sibling; the Monsta 280.) The UT60 280 has turned in 3 very solid comparative results with a Push Only fan assembly. The core then seems very well balanced, with a hint of bias for higher speed fans..
Let’s find out how the UT60 280 performs with Push/Pull fans.
Push/Pull Data vs. Competition
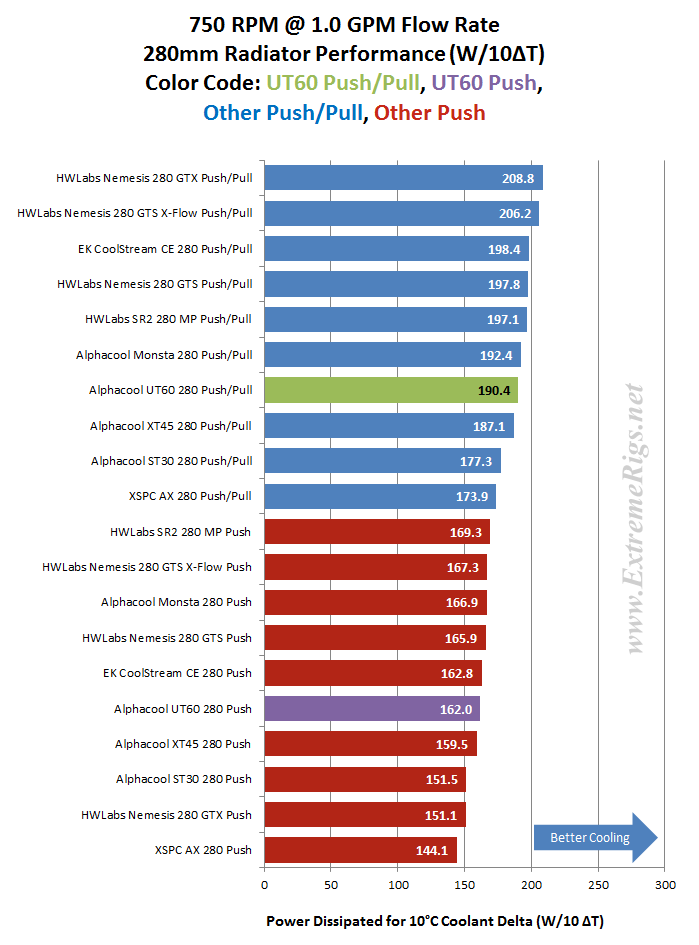
Firstly the 750 rpm:
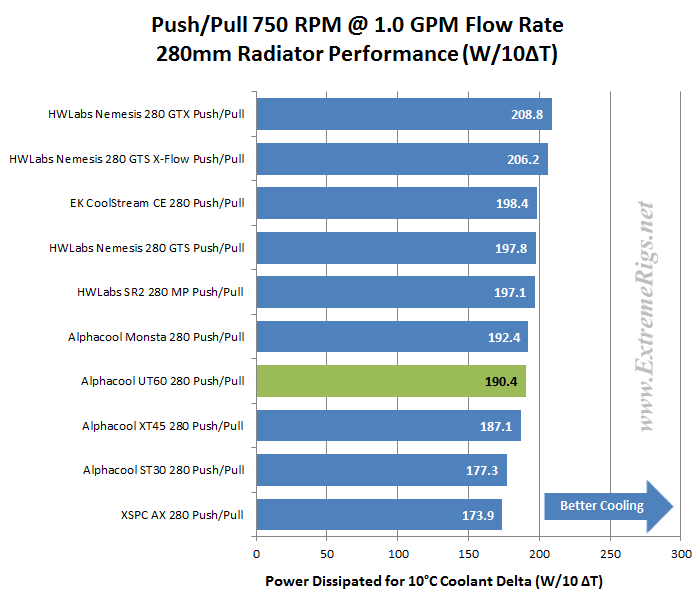 The UT60 280 and the other Alphacool radiators don’t rank particularly well in at this data point. Other models are better tuned it seems. At 1850 Push/Pull the UT60 places 7th and is ~9% behind the leader.
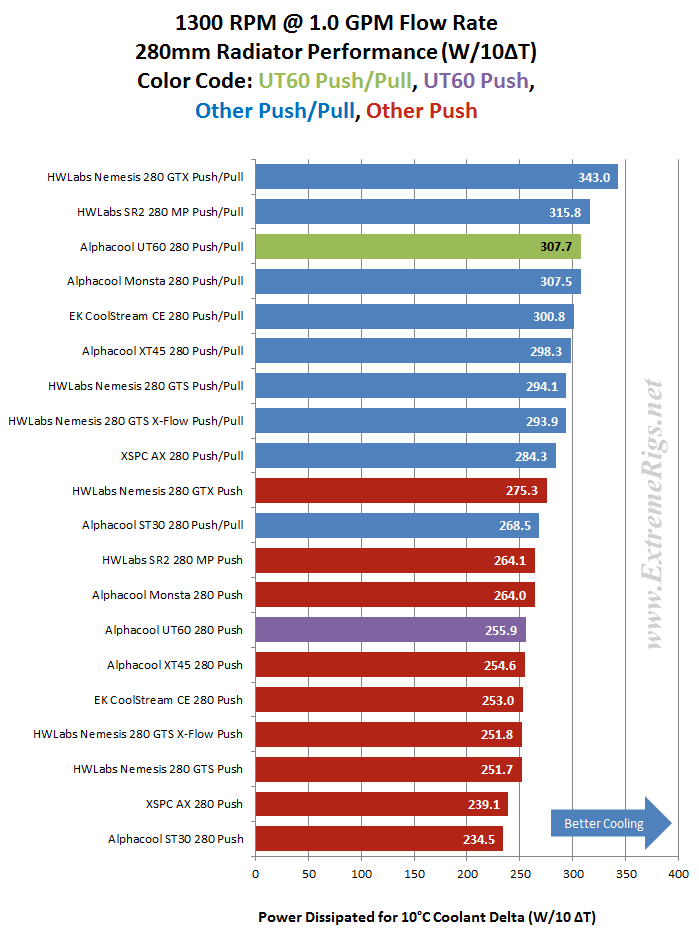
Let’s move to 1300 rpm:
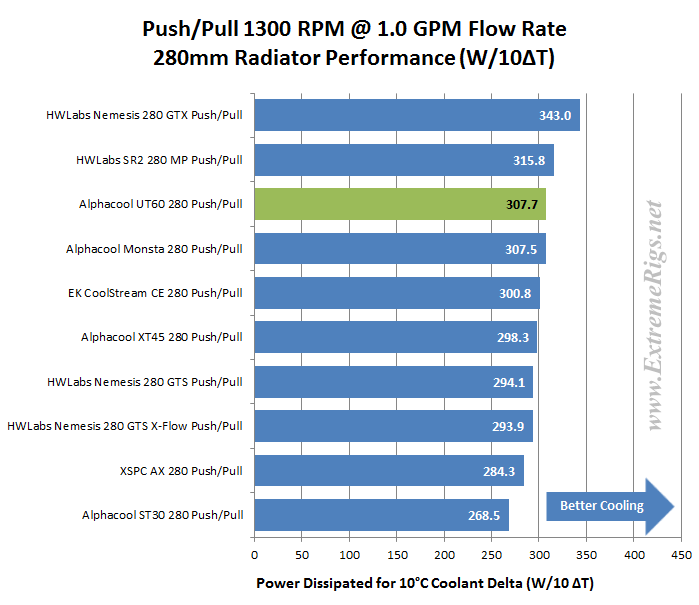 At 1300 rpm Push/Pull the UT60 280 has found it’s sweet spot, taking another (equal) 3rd place ranking (within test error margins) with the Monsta 280. The Nemesis GTX is streaking away from the pack and is ~10% ahead of the UT60 280 at this point.
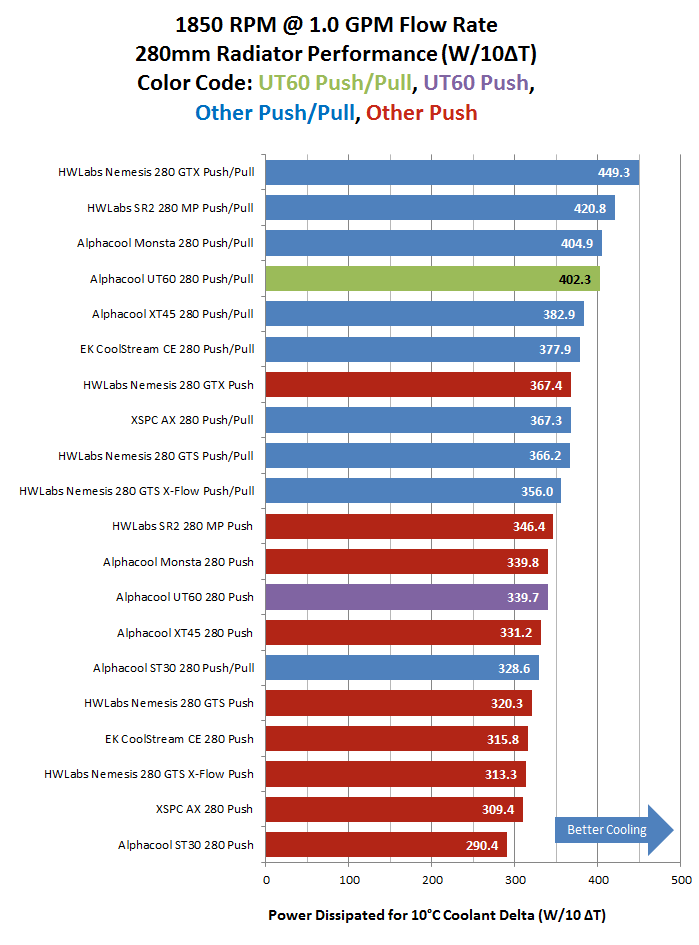
Now 1850 rpm:
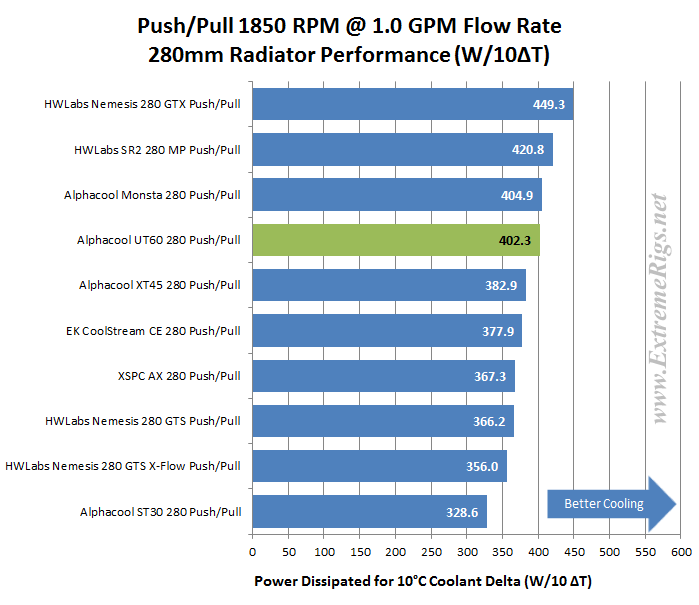 At 1850 rpm Push/Pull the UT60 280 dips slightly below the Monsta and takes out 4th place, ~9.5% behind the winning rad.
Let’s now combine the Push Only and Push/Pull results of our 1.0 GPM flow rate tests. Sometimes these combined plots show up points of interest. The combined 750rpm and 1300 rpm plots did not show anything up which was out of the ordinary or amazing this time, so I have decided to “spoiler” them. This way readers who like these plots can still see the data.
In the 1850 rpm combined we see perhaps the only interesting result concerning the UT60 280. It was one of 5 radiators which had a better Push Only result than the slim ST30’s Push/Pull result.
We’ll leave you to do some maths and figure out which has better value Vs. performance when factoring the price difference of the radiators and cost of your selected fans.
Another view of the same data, this time plotted as curves and some extrapolation added.
Be warned these plots can be hard to read given that many results are similar at the same data points.
Again the Push Only data first:
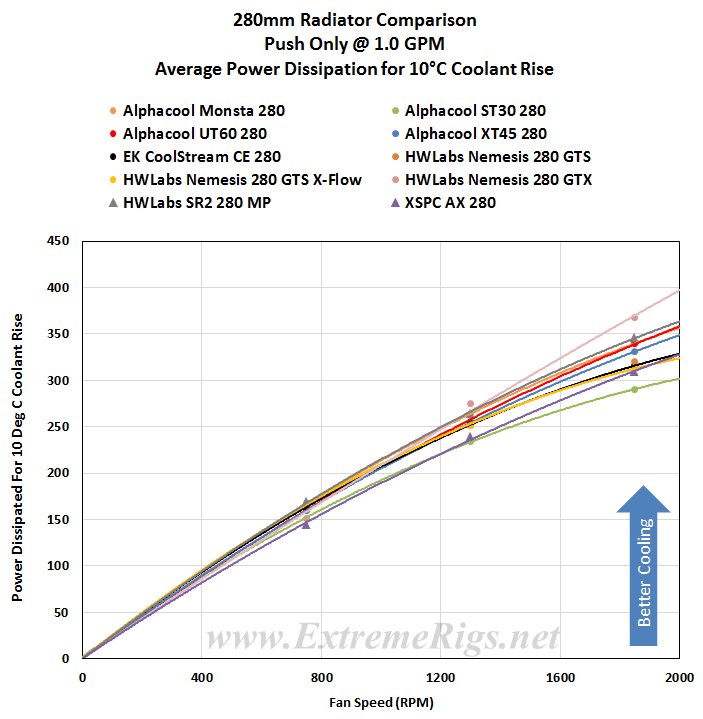 This perhaps best shows just how close the results are, particularly with low speed fans.
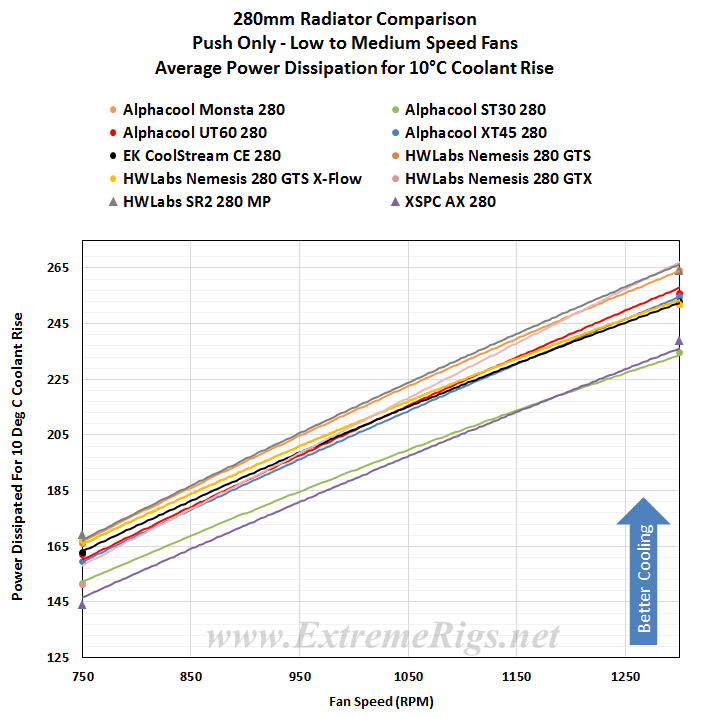
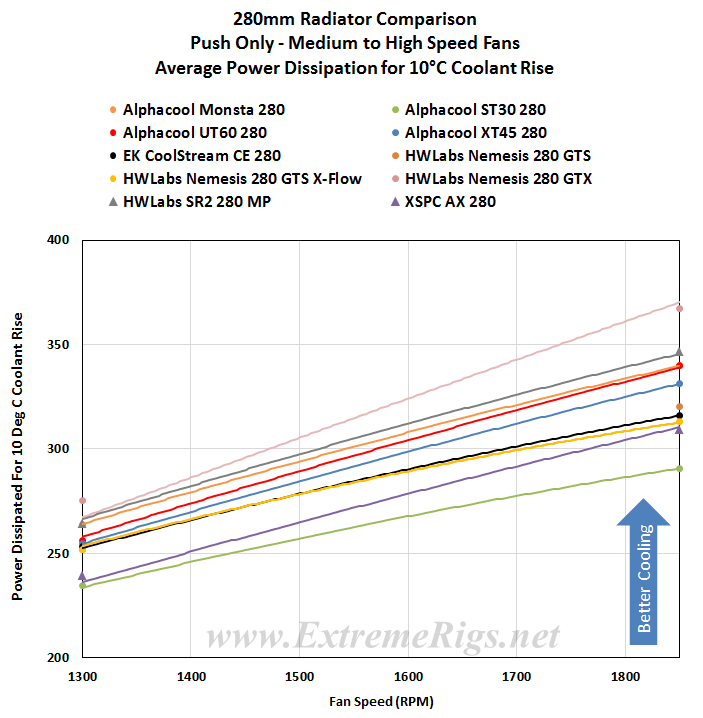
Because the data curves in plot above are almost blurred into one another, we have split it into two separate plots; 750 rpm to 1300 rpm and 1300 rpm to 1850rpm and zoomed in on those fan speed zones.
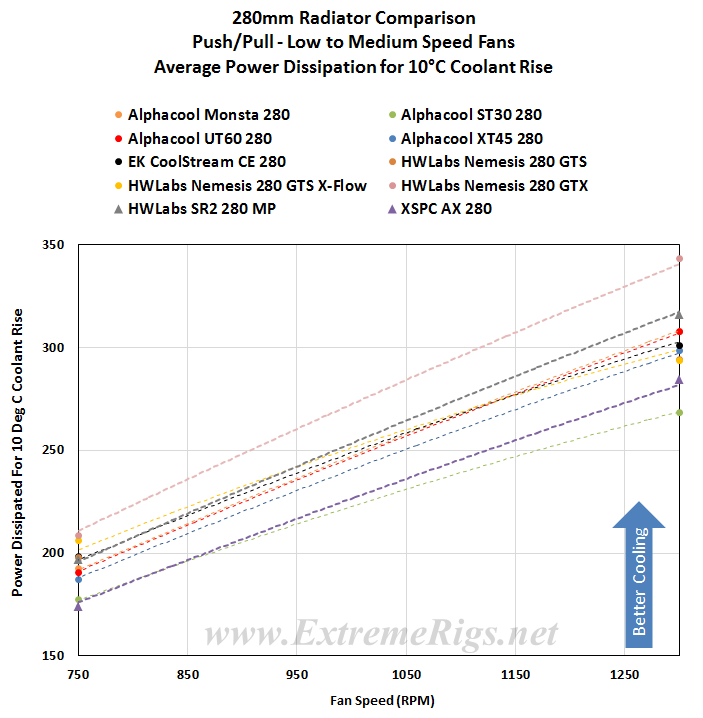
Now the Push/Pull results are plotted, again followed by split and zoomed versions.
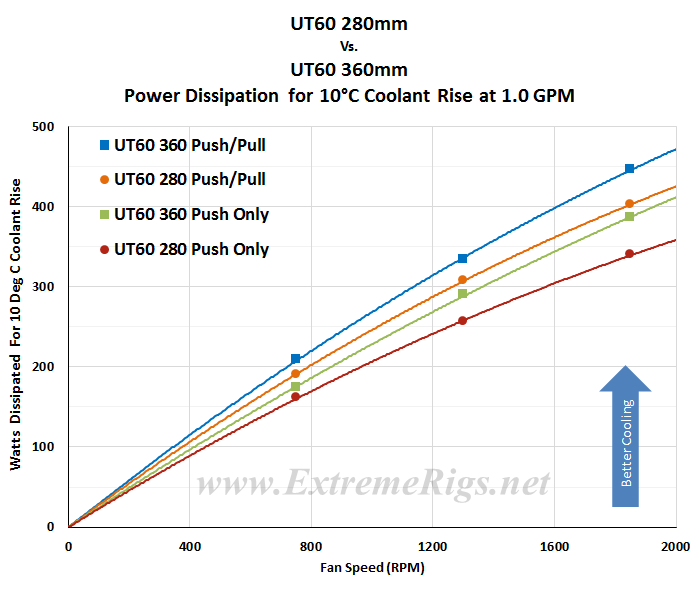
UT60 280 vs. UT60 360
Before moving on let’s take a quick look at the thermal results for the UT60 280 and UT60 360 on the same plot. This is one of those “just for fun” plots because in reality we can’t make a 1 to 1 comparison between the two sizes because of the differing performance of the fans used.
The UT60 280 has ~10% less surface area than the UT60 360. Knowing that and the difference in fans used to test the 120.x and 140.x radiators, interpret the following as you will.
Push Only 750 rpm: UT60 360 was ~7.5% better.
Push/Pull 750 rpm: UT60 360 was ~8.5% better.
Push Only 1300 rpm: UT60 360 was ~13% better.
Push/Pull 1300 rpm: UT60 360 was ~8.5% better.
Push Only 1850 rpm: UT60 360 was ~14% better.
Push/Pull 1850 rpm: UT60 360 was ~11% better.
Which is an overall average of 10.5% better performance in favor of the UT60 360, which has a 9.5% greater surface area. Nice!
From all the test results we created “Average Performance Factor” charts for both Push Only and Push/Pull. We then made a combined plot of the average called the “Master Performance Factor”. The radiator with the best cooling ability (W/10ΔT) at each rpm was awarded a score of 100. Each other radiators W/10ΔT result was scored as percentage of the top performer.
This way of looking at the comparison takes away any advantages that a radiator may have at higher or lower fan speeds and looks at an overall average. While this appears fair it does tend to favor those radiators that are all-rounders and those radiators which do very well at high RPM. Most users should be more focused on their specific use case.
Here are the UT60 280’s percentage scores at each data point:
 This table shows us that the UT60 280 is on average ~8% behind the best performing radiator at each data point that was tested. The results “appear” to get worse with increased fan speeds, but that does not mean that the UT60’s performance got worse, more so that the best radiator got better as the fan speeds increased. When a radiator is within 10% at every data point, as the UT60’s was very close to achieving, it is a safe bet that it has very good overall performance with a balanced core suitable for any fan combination.
As these percentage scores are relative to the best performer at each data point, we again advise readers to cross reference specifications and results for each radiator and keep in mind your intended fan assembly and operating speed.
The percentage numbers in the table above offer another way of looking at the UT60 280’s results. But for our scoring system we need a way to reduce the categories while retaining the data. To do this we average the results for each fan assembly type giving us Averaged Performance Factors. We calculate this for Push Only, Push/Pull and finally an average of everything.
Firstly – the Push Only APF:
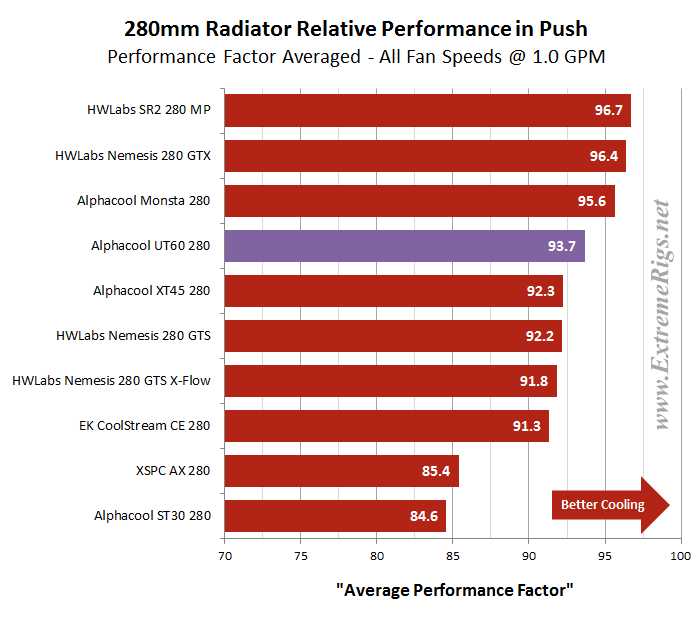 With an 93.7 % Averaged Push Only result the UT60 280 places 4th. It’s a great result for the UT60 and Alphacool in general, having 3 of the top 5 280mm models for Push Only.
Now the Push/Pull APF:
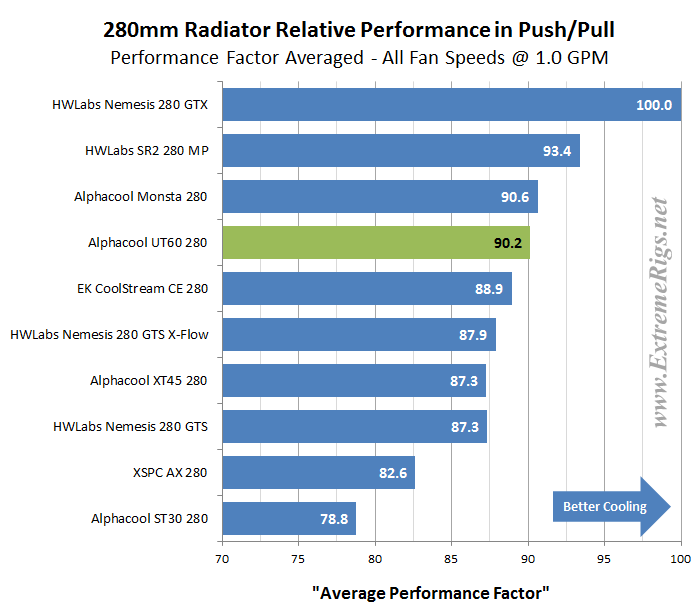 In the Push/Pull APF the UT60 280 takes an equal 3rd place with it’s thicker sibling, the Monsta 280. Any weak points were somewhat magnified by the 100% score of the Nemesis GTX which finished ~10% ahead of the UT60.
Finally we created the Master Performance Factor which is calculated from the averaged results of all the Push Only and Push/Pull thermal tests, at all fan speeds.
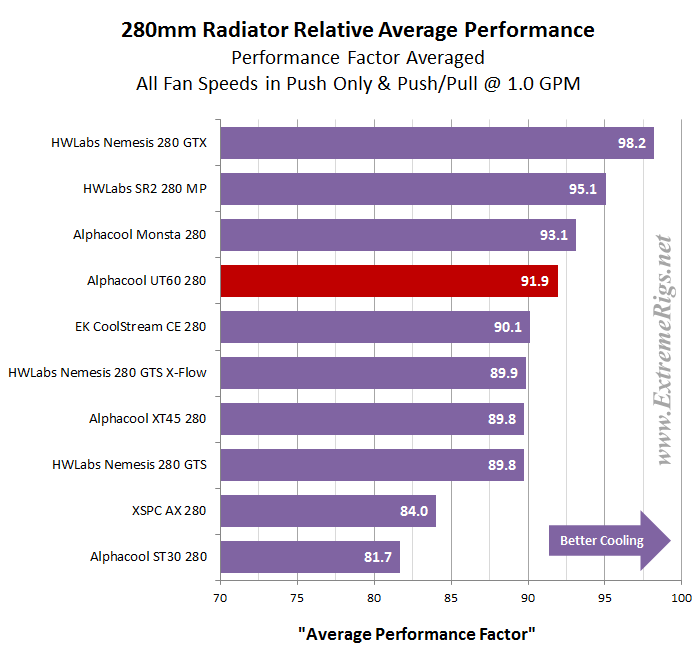 With a 4th place in the overall performance testing, the UT60 280 proved to be an excellent all rounder punching out good results at nearly every data point.
Space Efficiency
The UT60 280’s Space Efficiency vs. Performance ranking is unlikely to be very flattering as thinner rads almost always produce better results in this metric than their thicker counterparts. We have used the Average Performance Factor results from the charts above to compile two plots which shows us how it compares to the other rads in terms of performance vs. space taken.
First up is Radiator Thickness Vs. APF
Here the combined APF scores were divided by the radiator thickness only, with the highest (most space efficient) issued a score of 100. Each of the other radiators results was converted to a percentage of the most space efficient radiator’s score.
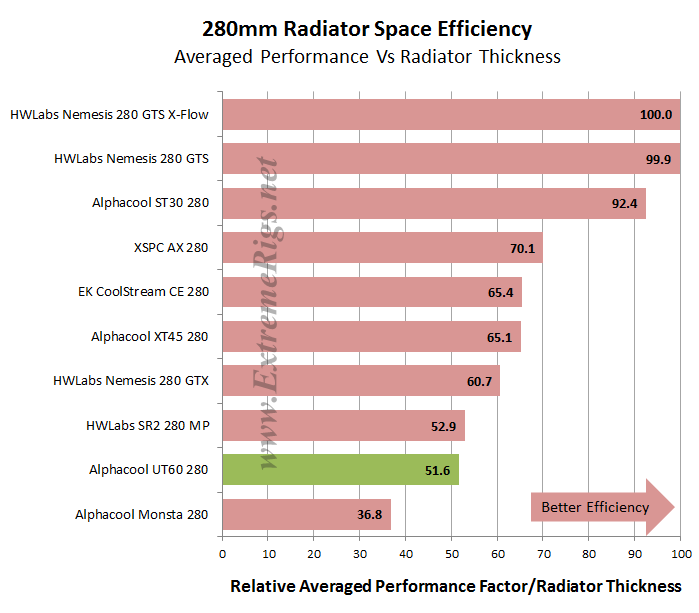 The order has ended almost in order of thinnest to thickest and as anticipated the UT60 did not fair so well in this assessment.
Next we took the APF results for Push/Pull and divided it by the total thickness including the fans and applied the same scoring system. For the Push Only we used the Push Only Vs Push/Pull comparative results and applied the same scoring system when compared against the Push/Pull. This plot is likely the most useful of the 2 plots for space efficiency.
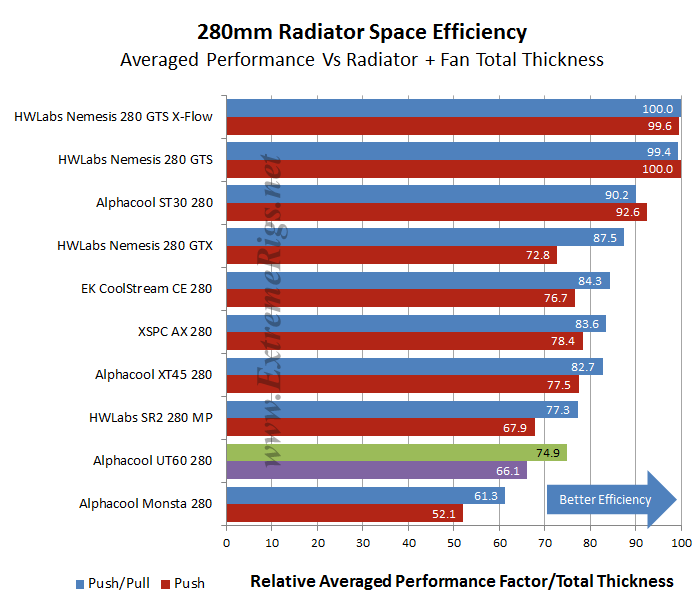 With fan thickness factored in the UT60 280 finishes 2nd last in both Push Only and Push/Pull. So while the UT60 is effective at heat dissipation it does so at the cost of taking up a lot of space because of it’s thickness.
Value Factor
While our APF’s are still fresh in mind, let’s now look at some Performance Results vs Price to show which of the 280mm radiators might offer the best bang for your buck. Each radiator’s combined APF scores were divided by the radiator cost and again we applied our scoring system of percentage Vs. the best performer of the category.
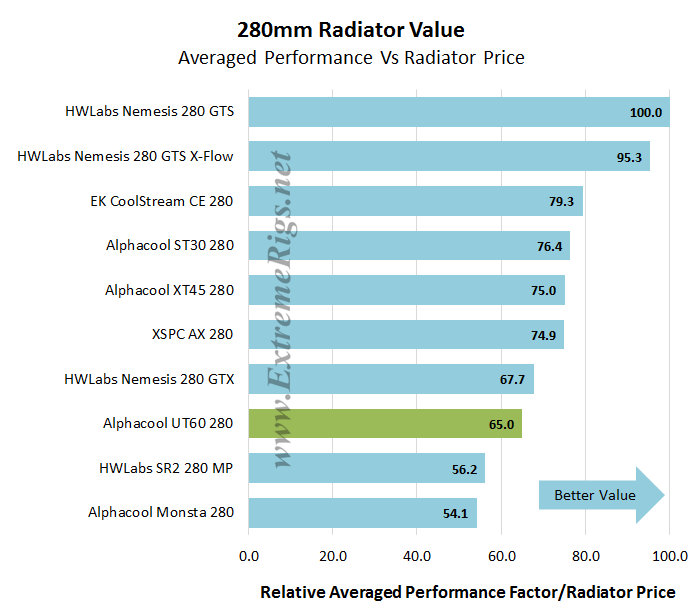
The UT60 280’s Value Factor turns out to be quite low, which tells us that it is not fantastic value for the performance potential it offers. In reality the difference is not great, but when visualizing with percentages as we have done, the gap appears large. Generally value and space efficiency metrics usually correlate – thicker radiators do contain more material afterall and so are usually also more expensive.
Next Up – Summary!
![]()


