


The Data
As all the testing was performed with the exact same equipment (except the 140mm Noctua Industrial fans replace the 120mm GT fans), using the exact same methods as was used in the 360mm round-up we have decided to keep this review uncluttered by keeping our testing methodology, test set-ups and equipment used in a single location. To see exactly how the tests were carried out, details of the test set ups and equipment used, please head over to the RRU Test Setup page.
Restriction Test
It is generally agreed that radiators are one of, if not the least restrictive components in the water cooling loop. There are some exceptions however, so this must still be verified through testing:
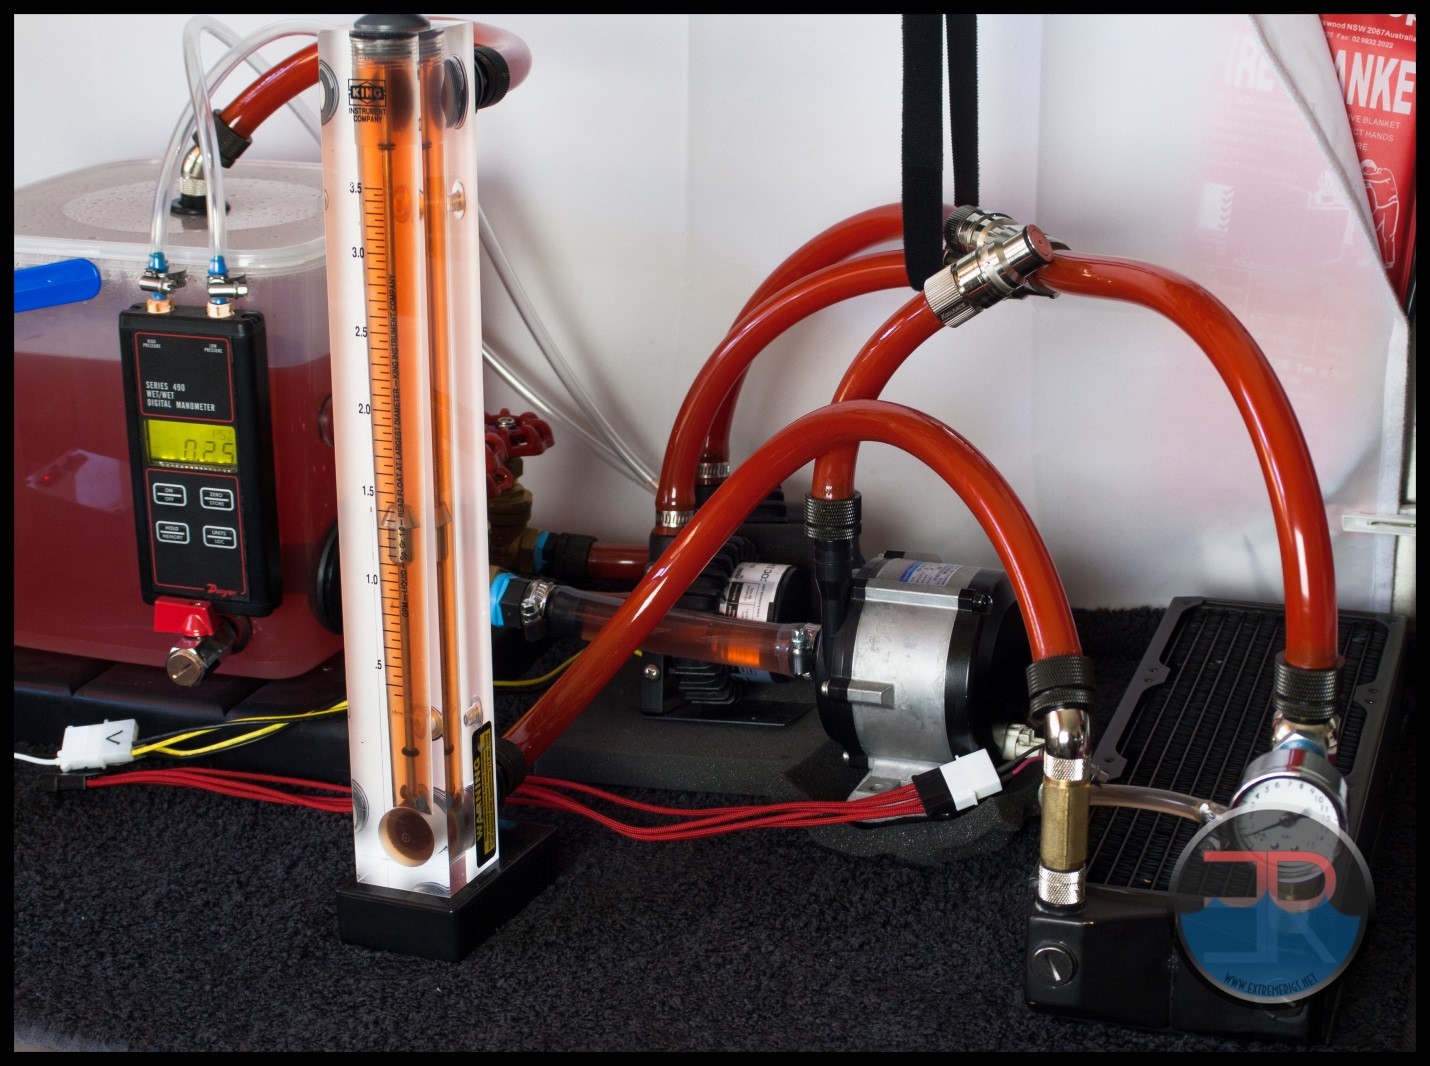 The above photo is for referencing the restriction test bench The UT60 280 is not loaded so please disregard the data in the picture as it does not relate to the its test results.
Here is the raw data at the tested flow rates, displaying the measured Differential Pressure across the radiator as flow rate was increased.
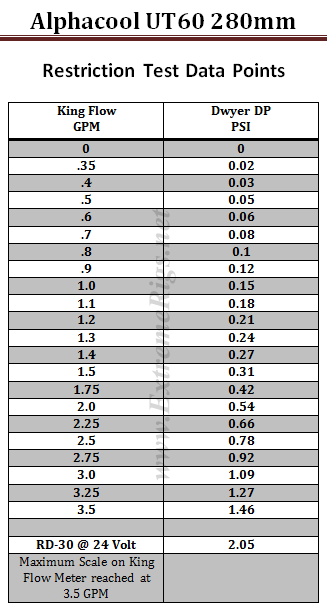 The table numbers indicate that this UT60 280 is a very low restriction radiator as one might expect with 3 layers of tubes. However numbers in isolation can only tell half the story. By plotting against other components it more easily shows the whole story.
We use a HeatKiller 3.0 CPU block as the reference in this next plot for two reasons. Firstly there is little chance of the plot being cluttered by curves overlapping and secondly it gives a reference point against a fairly common loop component of average restriction.
As with all previous radiator restriction plots, we have limited the maximum flow rate displayed to 2.0 GPM as we suspect there are very few systems that operate above 2.0 GPM. For more information on how to read a restriction plot check out our guide.
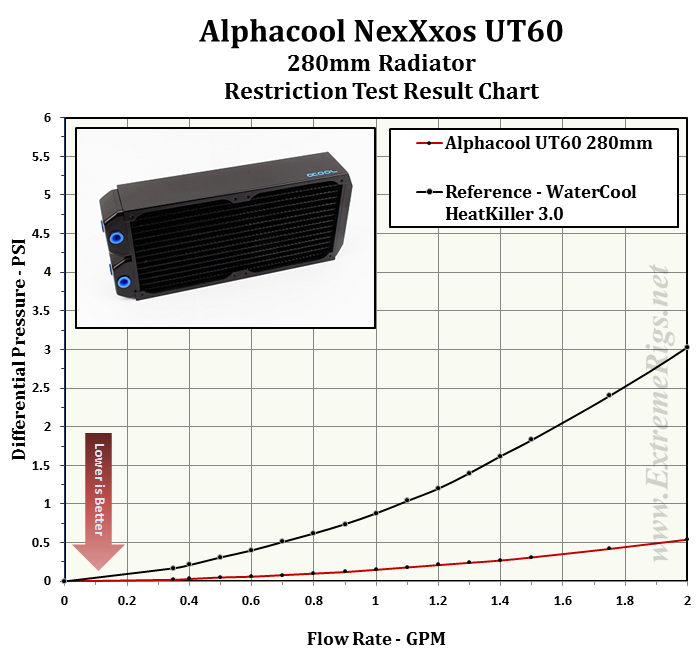 This plot indicates the UT60 280 is a very low restriction loop component when compared to a CPU block of average restriction, but what about other radiators?
The next three plots show the restriction level at three different flow rates compared to the other 280mm radiator that have been tested. We consider the chosen GPM rates to represent systems which have low, medium and high flow rates.
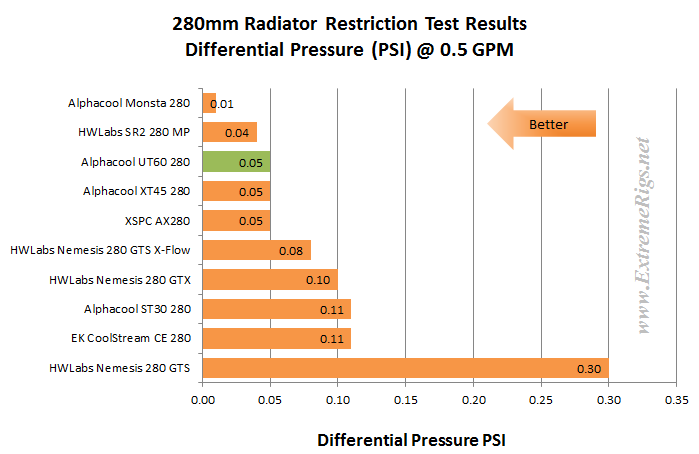
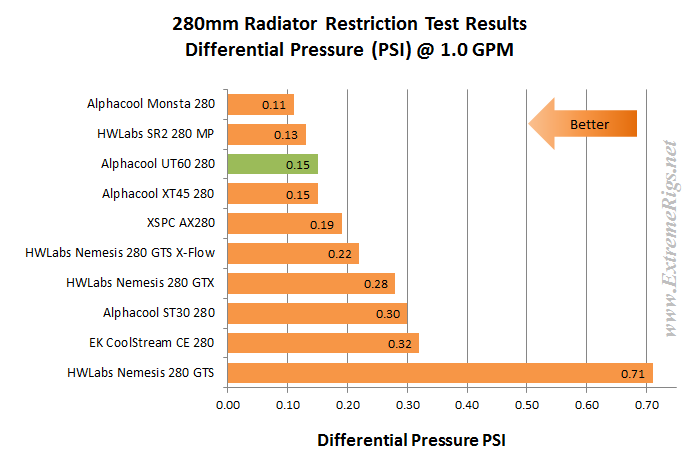
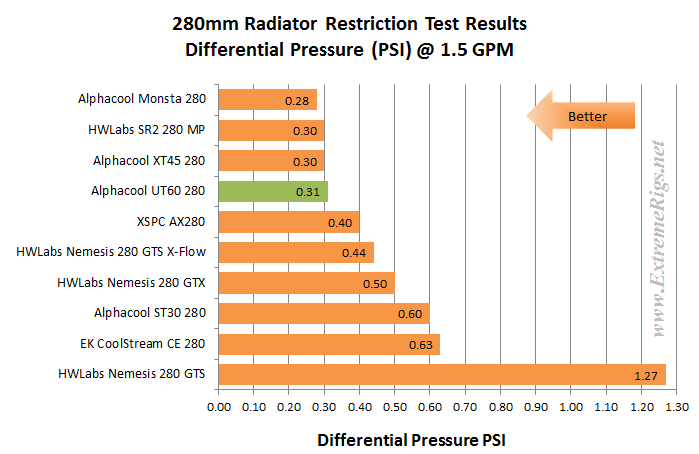
The UT60 280 is among the least restrictive of the radiators in our test group at all flow flow rates which were chose to compare against. Three layers of tubes for the coolant to pass through means less pressure is build up at the inlet port which results in less pressure difference between the inlet and outlet ports. This difference in pressure is exactly what we are measuring in this test.
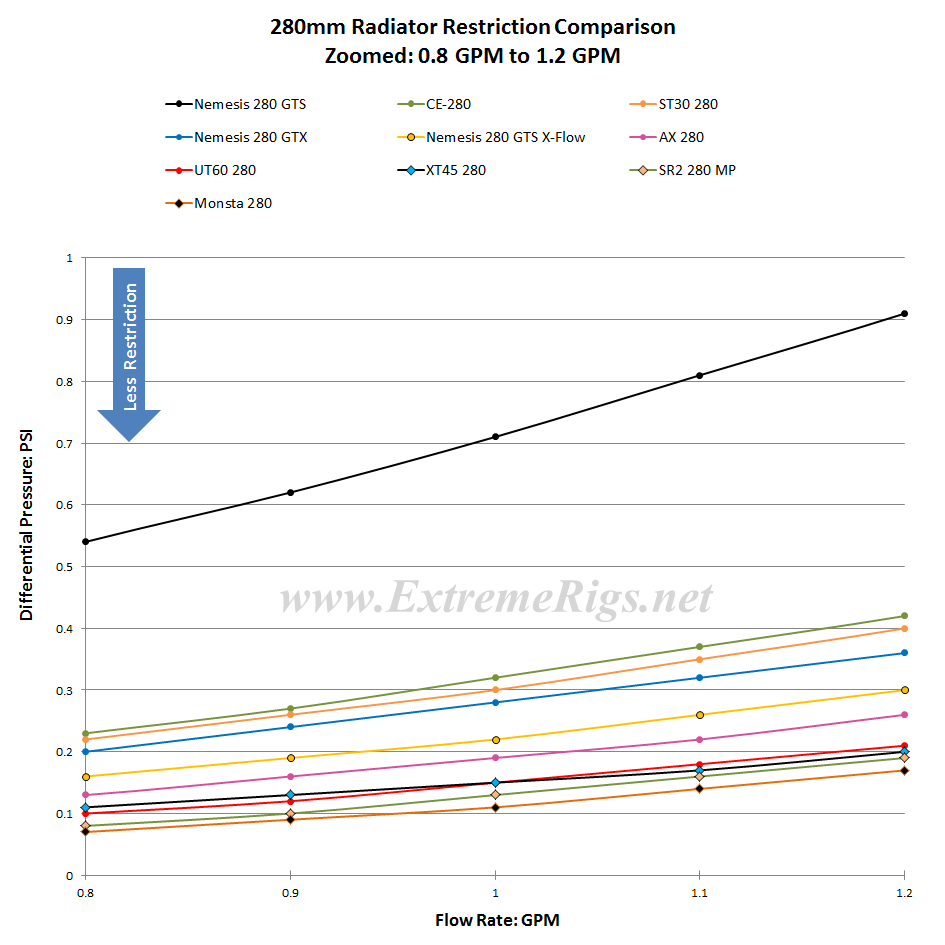
In the following plot the data has been zoomed in to display only between 0.8 GPM and 1.2 GPM which is what an average system’s flow rate would be running at. Clearly there is not a lot of variance between the least restrictive radiators of the group.
Let’s now take a look at where the UT60 280 fits in relation to all the radiators we have tested. For this plot, only results for 1.0 GPM have been used for the comparison.
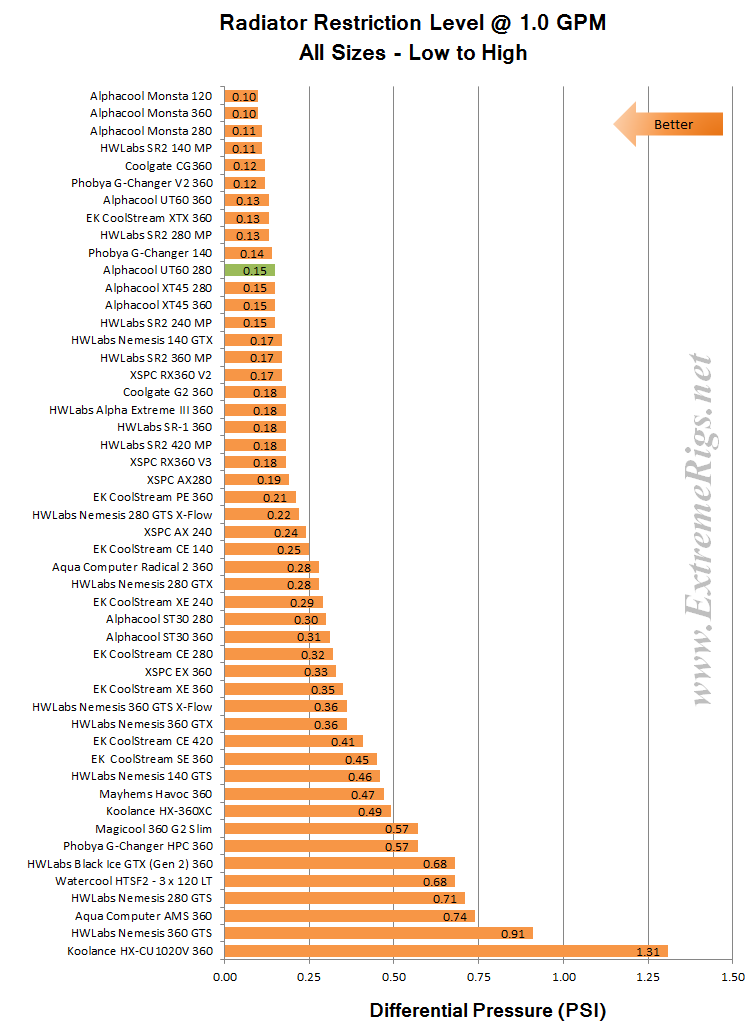 When put into context with all the radiators at 1.0 gpm, the UT60 280 fits into our criteria as a low restriction radiator. This means you could easily have numerous UT60 series radiators without having to be concerned about them reducing your flow rate by very much at all.
Excellent!!
Next onwards to Thermal Performance.
![]()


