


The Thermal Data
A total of 6 tests were conducted at 1.0 GPM with fan speeds of 750 rpm, 1300 rpm and 1850 rpm being run in ‘Push Only’ and ‘Push/Pull’. All inclusive this testing takes between 40 – 50 hours of logging time (plus processing the data) to get the results that are presented.
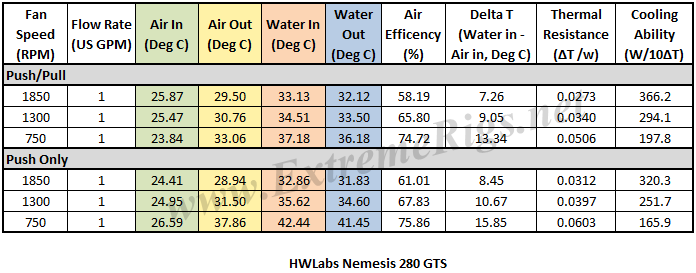
Below is the final data results gathered from at least 5 data logging runs at the flow rate and fan rpm combination. The most stable 15 minute period from each logging run was used and then averaged with the other runs to obtain the data for the table below. A total of 16 temperature sensors are used in the thermal test chamber (8 air in, 2 air out, 3 water in, 3 water out). Each sensor takes a reading every second and is logged via a CrystalFontz unit.
The data in the table below is the averaged results of the logging runs which has then been used to create all the plots and tables there-after.
 The performance metric of critical importance is the delta between the warm coolant temperature in and the cool ambient air temperature going into the radiator. Given that the system is well insulated and in equilibrium and we know the heat input to the system then we can also calculate a very important number. That number is the amount of power required to raise the coolant temperature by set amount. That amount is typically 1C or 10C. The latter is a more useful reference point.
Let’s take a look at the Delta T results from the tests. Note that the extrapolation of the curve is much more sensitive to error than in the tested range.
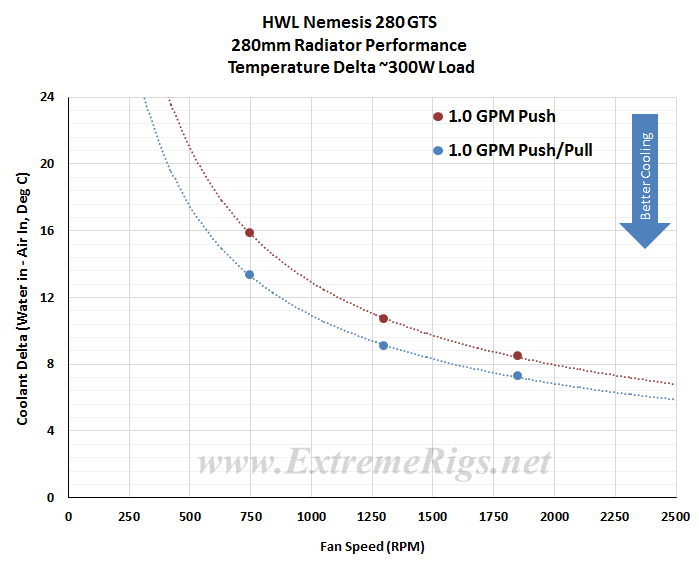 I was not too concerned about the actual delta numbers but instead the trend pattern. As we should expect, the deltas come down as the fan speed is increased. The less significant temperature drop from 1300 to 1850 rpm indicates the bulk of the radiators performance potential can be achieved with low and medium fan speeds.
Delta T results (as above) are not always helpful when thinking about how many radiators you would need to cool your system. Instead it’s more useful to know the metric of W/Delta C. This metric is plotted below. It tells us how many Watts are dissipated by the radiator when the coolant rises 10C above ambient temperatures. (W/10 Delta T):
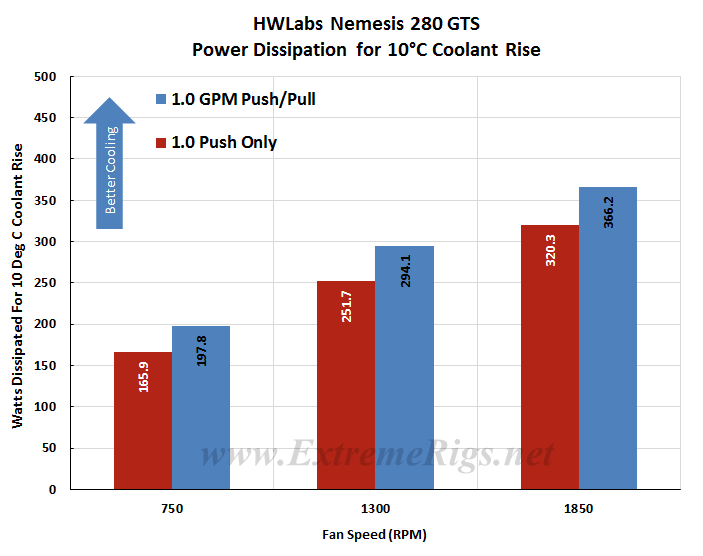 The average difference between Push Only and Push/Pull results at the same fan speed was ~13%, and ranged from ~14.5% at 750 rpm to 11.5% at 1850 rpm. With percentages lowering as fan speed increased means the Nemesis 280 GTS has less gains from the additional airflow and is no doubt due to the thinness of it’s core. The percentages are quite close though, indicating that the potential performance scales evenly across different fan assemblies as the fan speeds are increased.
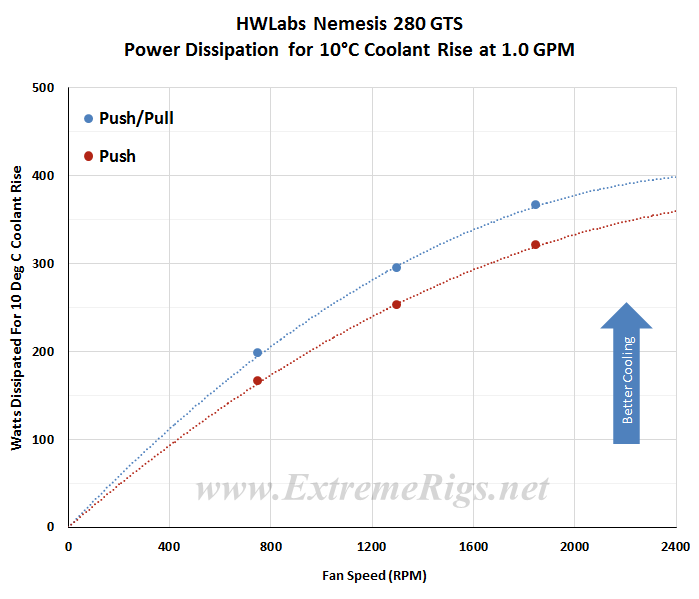
This same data can now be plotted on a chart so that an end user can interpolate their own fan speed. Note again that the extrapolation of the curve is much more sensitive to error than in between the tested range.
Now let’s analyze that data some more…
![]()


Another great radiator review! I love the exact TDP dissipation numbers at different fan speeds.
The GTS series looks like the radiator to beat in the thin category. I especially like the fact that these are non-louvered designs which seem to require less static pressure than louvered, and obviously “store” less dust. I have both the white GTS and GTX radiators in 280mm, as well as an L-Series which is a bit easier to fit because it has the reduced width. All have been great even at low fan speeds. I have a crossflow 280GTS and a 280GTS L-series in a modified Corsair 350D with hih airflow front panel, with push only Thermaltake Riing fans (140mm) and they cool my i7 5960x at 4Ghz and my 980Ti at 1.55ghz (I got lucky) amazingly at 1000 RPM. Highest temps on the i7 5960x at 1.20 volts are 65 celsius (except with Prime 95 AVX which goes to 75) and the 980Ti is only at 43 celsius at full bore, and my water temps are only around 6-8 celsius Delta-T. Amazingly quiet and cool. I could theoretically add another 980Ti to the loop with only a slight increase in fan speeds and not have to worry about over-subscribing the water cooling loop, based on the heat dissipation potential shown here.
Comments are closed.