


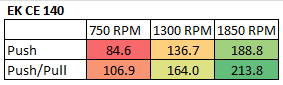
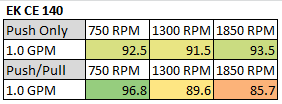
This first table shows the CE 140’s Watts/10 Delta Temp numbers in a quick glance chart format.
Using this data we can effectively show percentage gains/losses relative to a reference point. It’s an interesting way to show gains/losses while changing a variable.
So, let’s focus on 1300 RPM as our reference and see how much gain or loss in performance we get by changing fan speed.
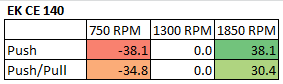
From these results we see the Push Only being very linear with rpm changes. While being pleased with a 38% performance gain with a fan speed increase, we are not so impressed about the 38% loss in performance when reducing fan speeds. While in Push/Pull the variation is much less dramatic. This all indicates the CE 140 core is best tuned for medium to high air flow as the core is probably too dense for low speed fans to move enough air through the core. While at the highest air flow the performance is tapering off because the core is not thick enough to use the extra airflow as effectively.
So from the data above we have a good idea of how the CE 140 radiator performs relative to itself. But there is a large selection of 140mm radiator models to choose from.
We have some other 140mm radiators with thermal testing completed. So let’s put the CE 140’s results into some comparison charts.
Push Only Data vs Competition
Let’s focus on the Push Only results for now and come back to the Push/Pull data later.
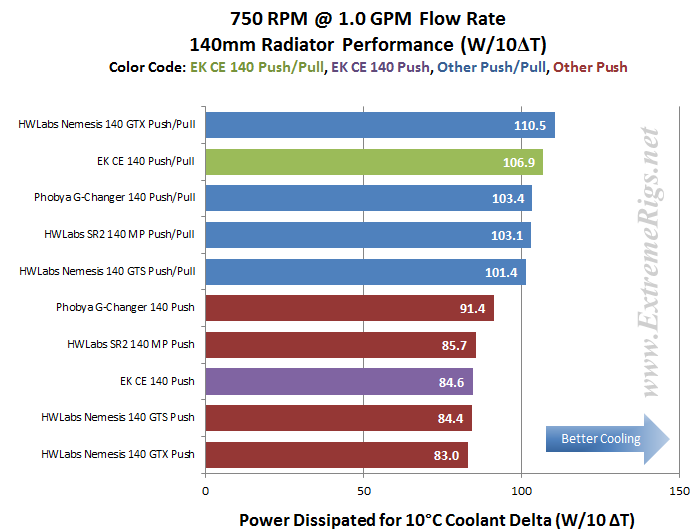
Let’s start with 750 RPM and see how the CE 140 compares.
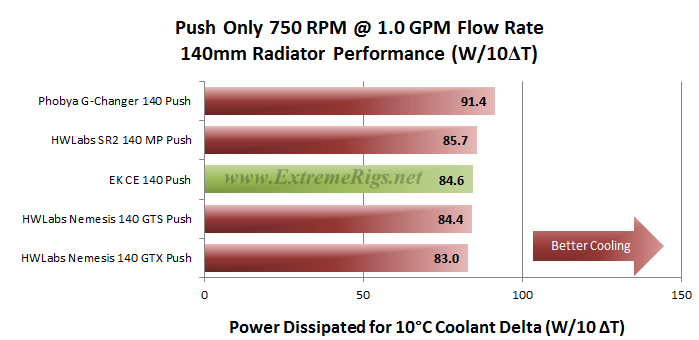
While we hesitate to make predictions, this is right about where we expected the CE 140 to fit in given the varying thickness and core density that each of the radiators have. The rads which had better performance are both thicker but have a lower fin count allowing better efficiency. The Nemesis GTS below the CE 140 is 33% thinner but has equal performance demonstrating great air deficiency.
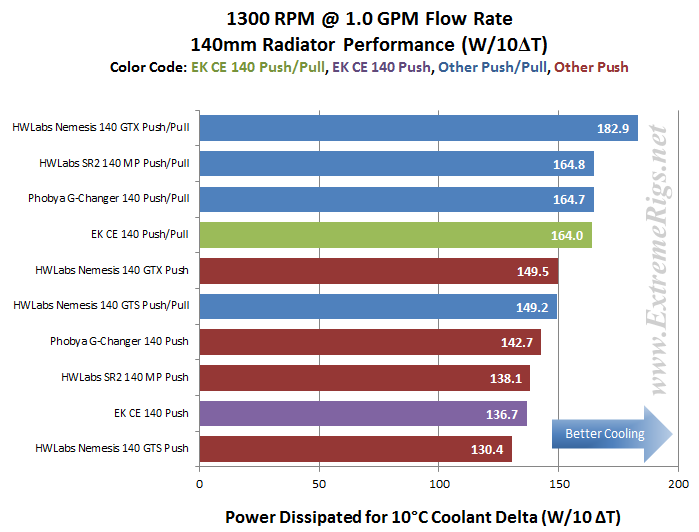
Now let’s look at 1300 rpm:
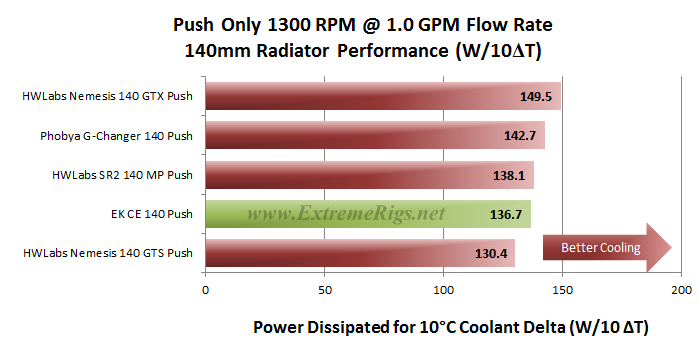
At 1300 RPM the CE 140 places fourth. With more air flow the thicker rads gain the advantage.
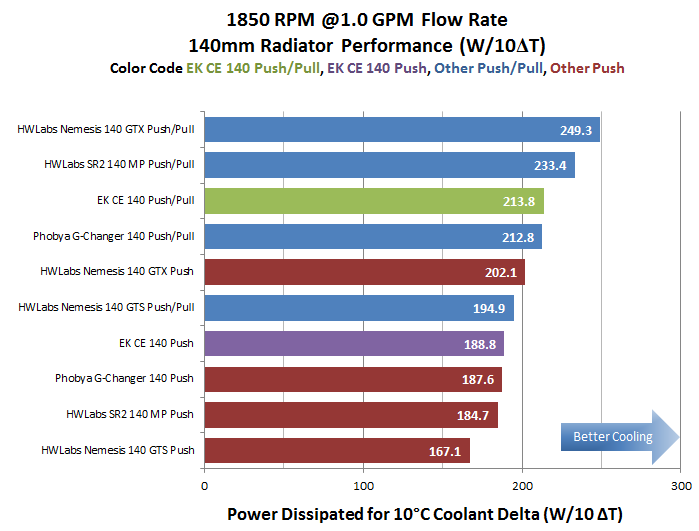
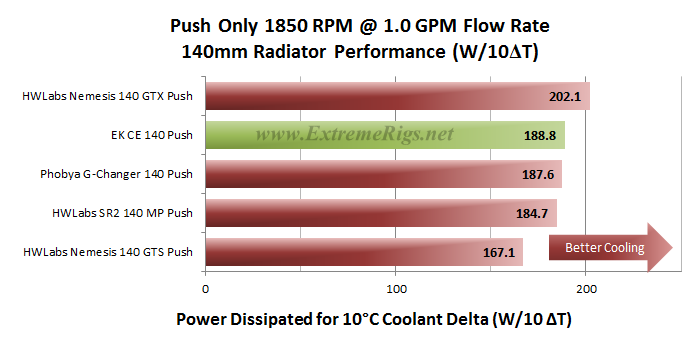 At 1850 rpm the CE 140 jumps up into 2nd place. It’s higher fin count now trumps the thicker lower FPI rads.
This all fits nicely with our earlier assessment of the CE 140 being tuned best for medium to high air flow fan assemblies. Therefore we expect similar rankings in the Push/Pull comparisons, but we always get some surprises.
Let’s find out how the CE 140 performs with Push/Pull fans.
Push/Pull Data vs. Competition
Firstly the 750 rpm:
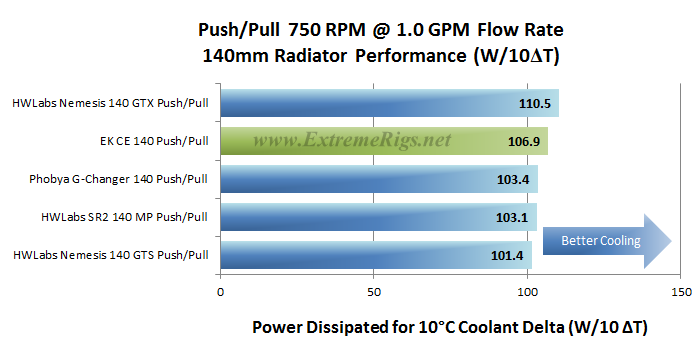 The CE 140 continues it’s great performance taking another 2nd place and is just ~3% behind the Nemesis 140 GTX which is becoming the dominant radiator of the test group.
Let’s move to 1300 rpm:
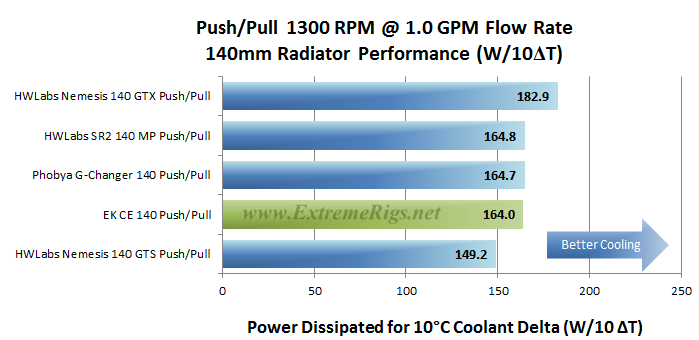
In the 1300 rpm Push/Pull category the CE 140 result lands it in 4th place, but the 2nd to 4th place results are virtually identical and with our test error margin, so we have to call it a 3 way tie for second place. Given that the CE 140 is the thinner of these 3 radiators it is therefore the better in terms of space efficiency vs. performance.
Now 1850RPM:
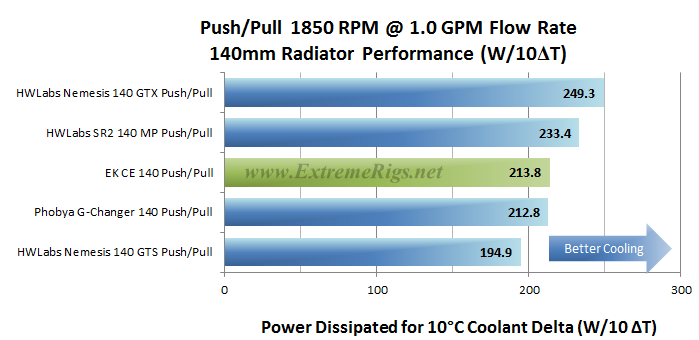 At 1850 rpm Push/Pull the CE 140 places 3rd while the 2 thicker HWLabs samples streak away from the pack.
Let’s now combine the Push Only and Push/Pull results of our 1.0 GPM flow rate tests. Sometimes these combined plots show up some points of interest.
Again the 750 rpm first:
Nothing looks out of place here..
At 1300 rpm everything looks in order given the data we’ve already reviewed.
It was exactly the same with the 1850 combined.
And one last view, plotted as curves and adding some extrapolation.
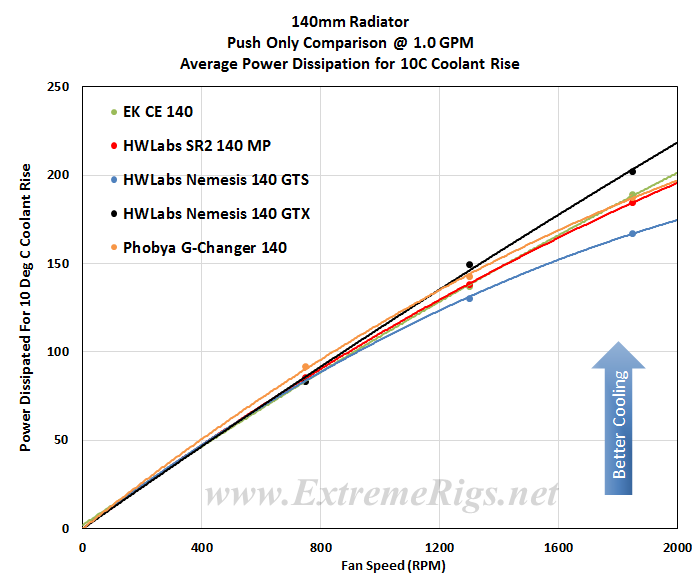 This perhaps best shows just how close the results are!
In the Push/Pull setup we see a bit more separation occurring. As the fan speeds are increased the different core designs show their strengths and weaknesses.
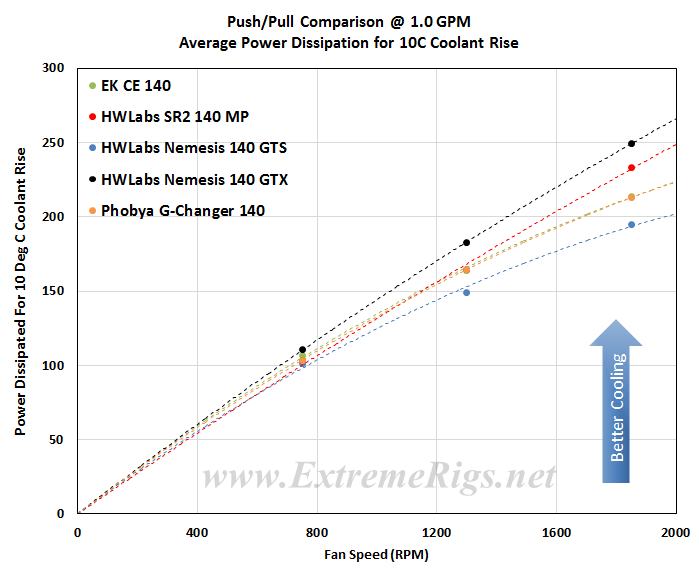 The CE 140 and Phobya G-Changer have such similar results that the EK result is somewhat hidden behind the Phobya’s. This is actually a very good thing for the CE 140 because it is only 45mm thick vs. the 60mm thickness of the Phobya.
From all the test results we created “Average Performance Factor” charts for both Push and Push/Pull. We then made a combined plot of the average called the “Master Performance Factor”. The radiator with the best cooling ability (W/10ΔT) at each rpm was awarded a score of 100. Each other radiators W/10ΔT result was scored as percentage of the top performer.
This way of looking at the comparison takes away any advantages that a radiator may have at higher or lower fan speeds and looks at an overall average. While this appears fair it does tend to favor those radiators that are all-rounders and those radiators which do very well at high RPM. Most users should be more focused on their specific use case.
Here are the CE 140’s percentage scores at each data point:
 As these percentage scores are relative to the best performer at each data point, we again advise readers to cross reference specifications and results for each radiator and keep in mind your intended fan assembly and speed.
The percentage numbers in the table above offer another way of looking at the CE 140’s results. But for our scoring system we need a way to reduce the categories while retaining the data. To do this we average the results for each fan assembly type giving us Averaged Performance Factors. We calculate this for Push Only, Push/Pull and finally an average of everything.
Firstly – the Push Only APF:
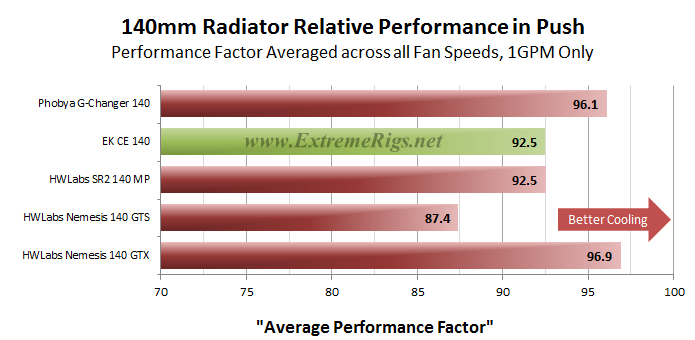 With a 92.5% averaged Push Only result the CE 140 places equal 3rd. This is an excellent result when we consider the core thickness differences.
Now the Push/Pull APF:
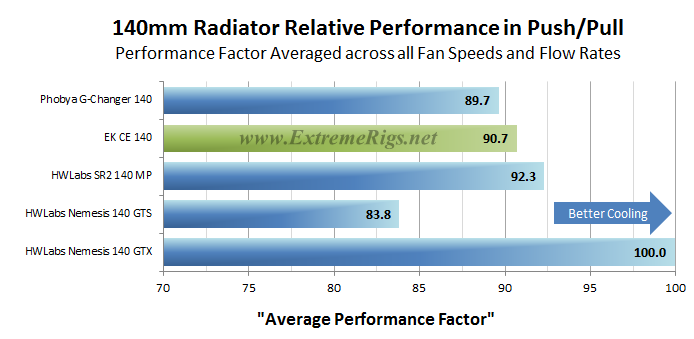 The CE 140 places 3rd in the Push/Pull APF.
Finally we created the Master Performance Factor which is calculated from the averaged results of all the Push Only and Push/Pull thermal tests, at all fan speeds.
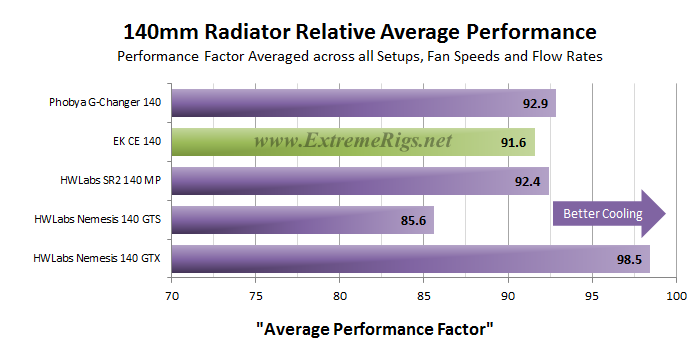 Overall the CE 140 placed 4th in our thermal tests, but by the smallest of margins. The 1.3% difference between 2nd and 4th is very small and on the border of our test error margin.
Space Efficiency
The CE 140’s thermal results are a great example to consider space efficiency vs. performance so we have used the Average Performance Factor results from the chart above to compile two plots which shows us how it compares to the other rads in terms of performance Vs. space taken.
Firstly is radiator thickness Vs. APF
Here the APF scores were divided by the radiator thickness with the highest (most space efficient) issued a score of 100. Each of the other radiators results was converted to a percentage of the most space efficient radiator’s score.
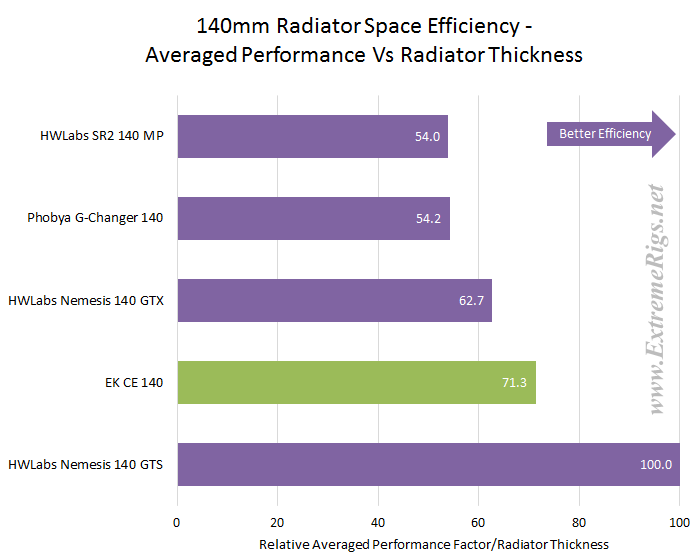
It is always the case that the thinnest rads are the most efficient space users, however as thickness increases the order starts to shuffle around as the varying core designs come into play. The CE 140’s second place demonstrates that the core is well tuned for it’s thickness.
Next we took the APF results for Push/Pull and divided it by the total thickness including the fans and applied the same scoring system. For the Push Only we used the Push Only Vs Push/Pull comparative results and applied the same scoring system when compared against the Push/Pull.
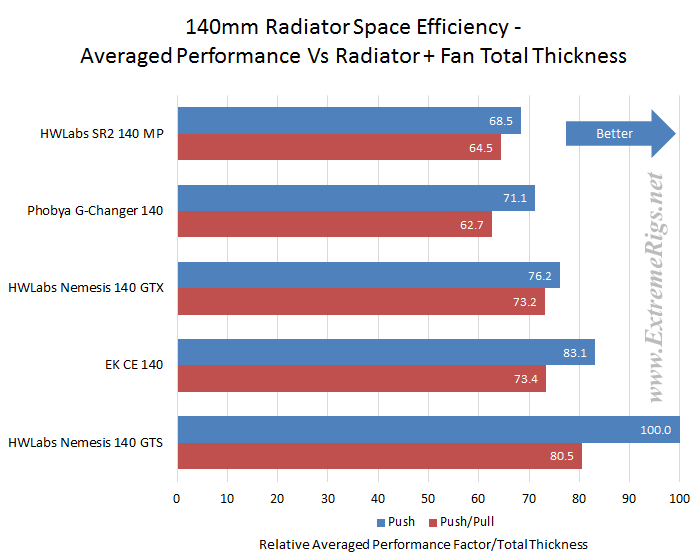 The plots above show us that the CE 140 is very efficient in Push Only for the amount of space it requires. While still ranking second in Push/Pull the thicker rads have closed the gap considerably.
Value Factor
While we were toying around with the APF results, we decided to look at some results vs Price to show which of the 140mm radiators might offer the best bang for buck. Each radiator’s combined APF scores were divided by the radiator cost and again we applied our scoring system of percentage Vs. the best performer of the category.
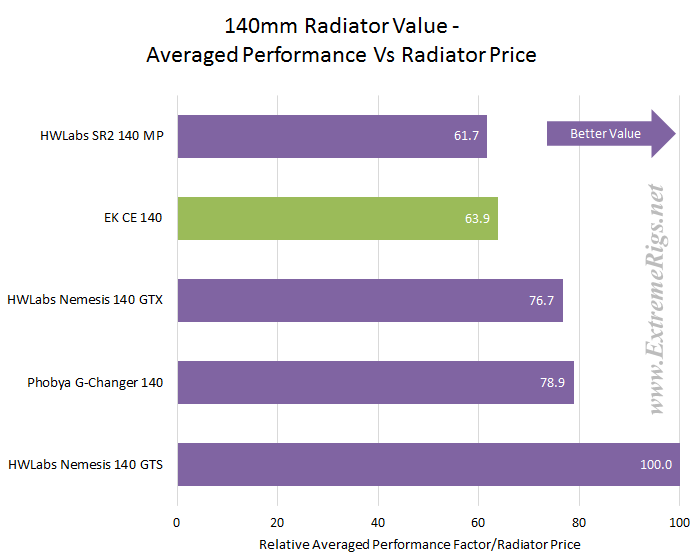 The CE 140’s Value Factor is on the low side which tells us that it doesn’t have very much “bang for your buck”. Another way of thinking about it is that the CE140 costs more to remove the same amount of heat compared to the majority of the test group. In reality the difference is not great, but when visualizing with percentages as we have done the gap appears large.
Next Up – Summary!


[…] EK CE 140 Radiator Hardware Labs Nemesis GTS 140 Radiator Hardware Labs Nemesis GTX 140 Radiator Hardware Labs SR2 140 Radiator Phobya G-Changer 140 Radiator […]
Comments are closed.