


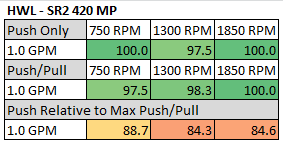
This first table shows the SR2 420 MP’s Watts/10 Delta Temp numbers in a quick glance chart format.
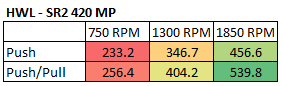
Using this data we can effectively show percentage gains/losses relative to a reference point. It’s an interesting way to show gains/losses while changing a variable.
So, let’s focus on 1300 RPM as our reference and see how much gain or loss in performance we get by changing fan speed.
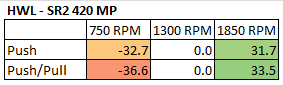
Very even results either side of 1300 rpm indicate that the core is tuned well for low speed fans as we don’t see any major boost in performance as fans speeds are increased.
So from the data above we have a good idea of how the SR2 420 MP radiator performs relative to itself in Push Only and Push/Pull at various fan speed, but there is a large selection of 420mm radiator models to choose from, released from numerous manufacturers.
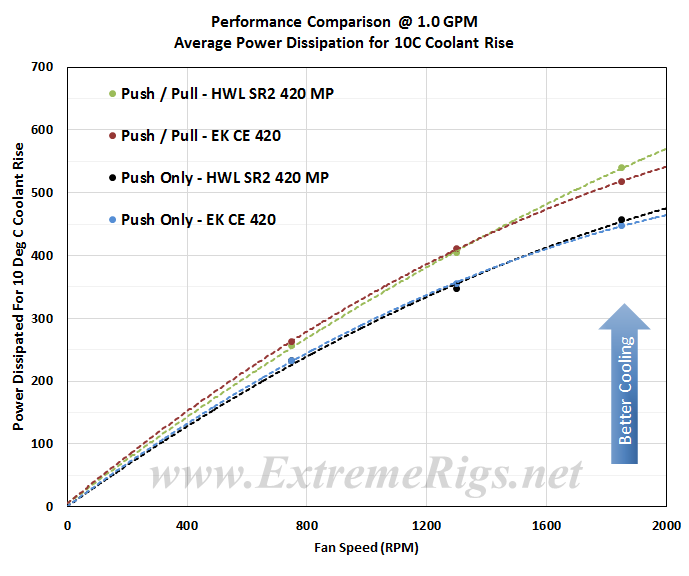
As we have another 420mm rad with thermal testing complete, let’s do just that by putting the SR2 420 MP head to head with EK’s CE 420. It may not be the fairest comparison ever done because while they are both 420mm radiators, that is about the only thing they have in common, The EK CE 420 is thinner and has a much denser core structure. The comparisons should prove interesting.
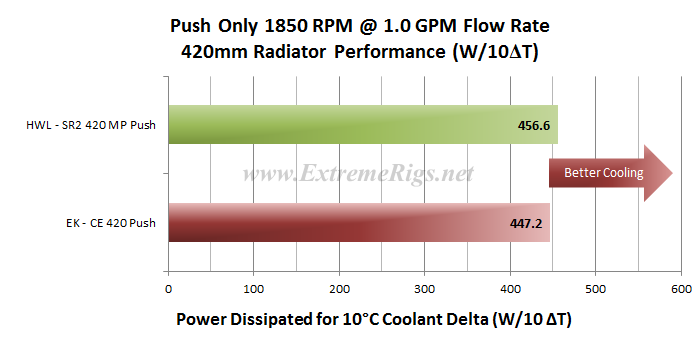
Push Only Data vs Competition
Let’s focus on the Push Only results for now and come back to the Push/Pull data later.
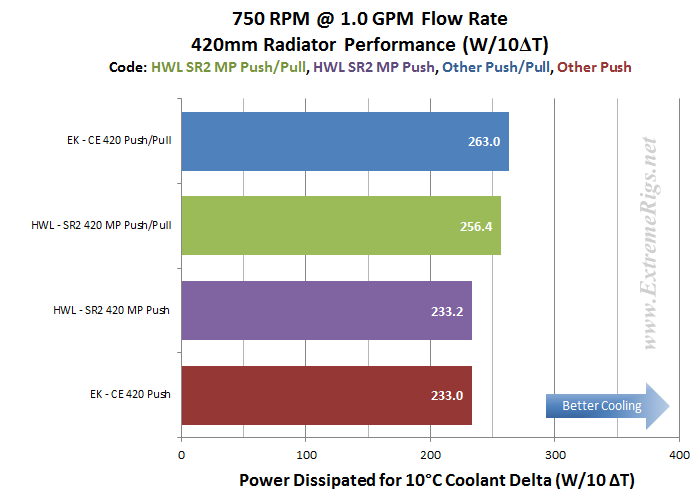
Let’s start with 750 RPM and see how the two compare.
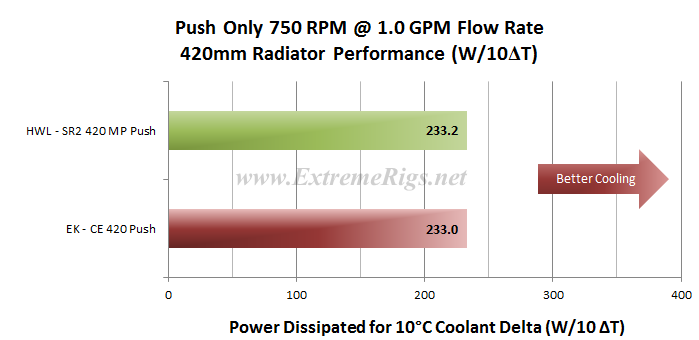
While we hesitate to make predictions this is the data point where we expected the SR2 to have a clear advantage over the EK CE. The result here is effectively a tie as both results are within the test error margins.
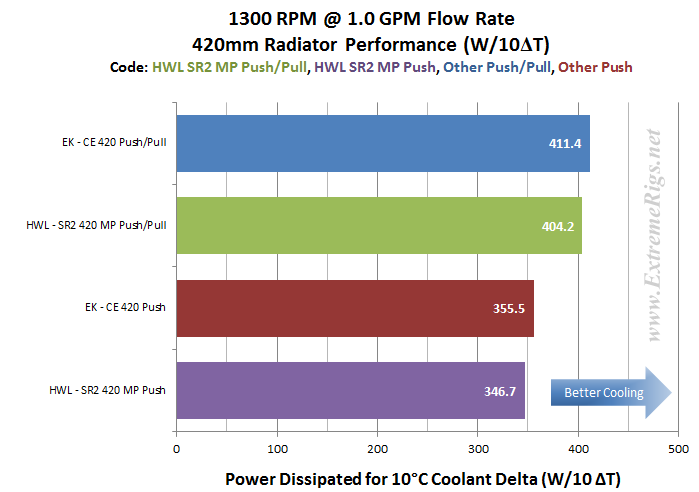
Now let’s look at 1300 rpm:
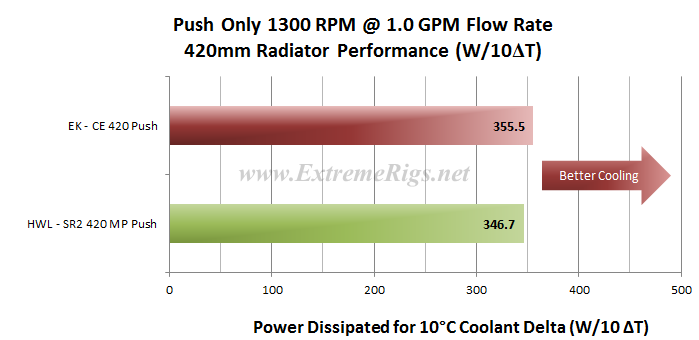
At 1300 RPM the CE takes the lead by ~2.5%, just enough to call a winner.
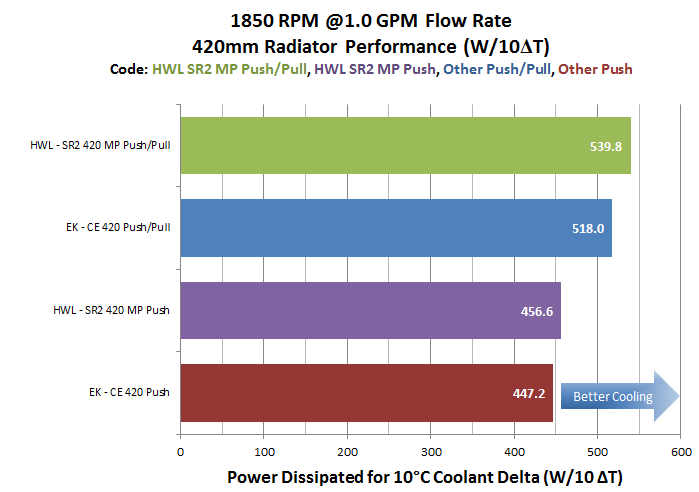
 At 1850 rpm the SR2 takes the lead again by ~2%. Its thicker core is presumably what is making the difference and why it didn’t fall further behind from the 1300 results.
So it appears (as expected given the low PFI count) that the SR2 is well tuned for low fan speeds but then also takes first place at the high speed fan data point. There is no clear winner of the Push Only thermal tests, perhaps the Push/Pull will see some separation between the two.
Let’s find out.
Push/Pull Data vs. Competition
Let’s now look at the Push/Pull results and see how the SR2 compares:
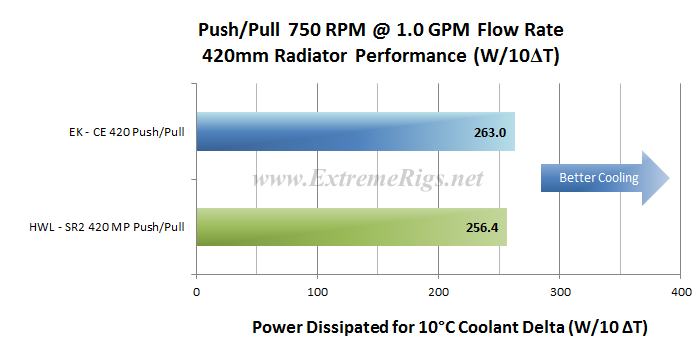 The SR2 takes second place ~2.5% behind the winning rad, and the very close results continue.
Let’s move to 1300 rpm:
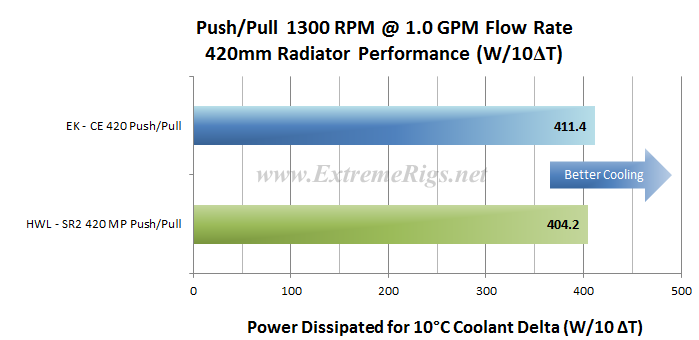
In the 1300 rpm Push/Pull category the SR2 420 MP closes the gap slightly, now just ~2% behind the CE.
Now 1850RPM:
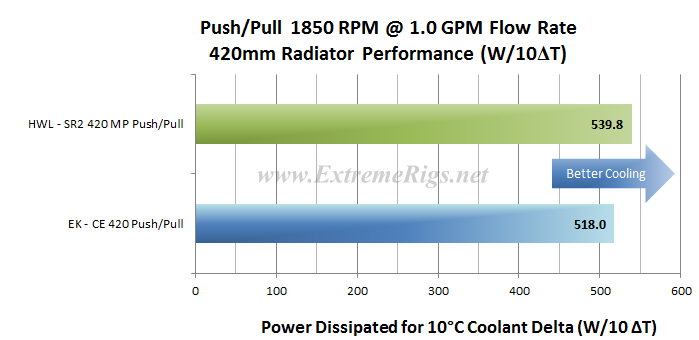
As with the Push Only result the SR2 again takes first place after trailing at 1300 rpm.
Let’s also combine the Push Only and Push/Pull results at our 1.0 GPM flow rate into one plot for each fan speed tested. Sometimes these combined plots show up some points of interest, but with the results being so close for both fan assemblies, I don’t expect to find much of interest this time.
Again the 750 rpm first:
Nothing looks out of place here..
At 1300 rpm everything looks in order given the data we’ve already reviewed.
It was exactly the same with the 1850 combined.
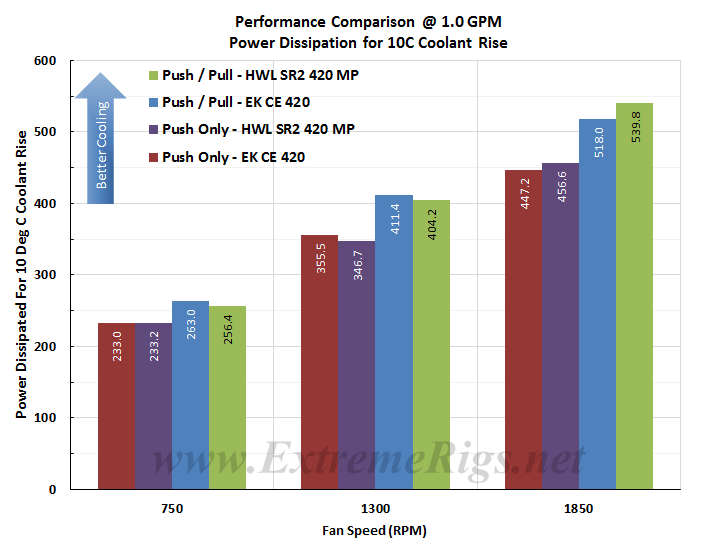
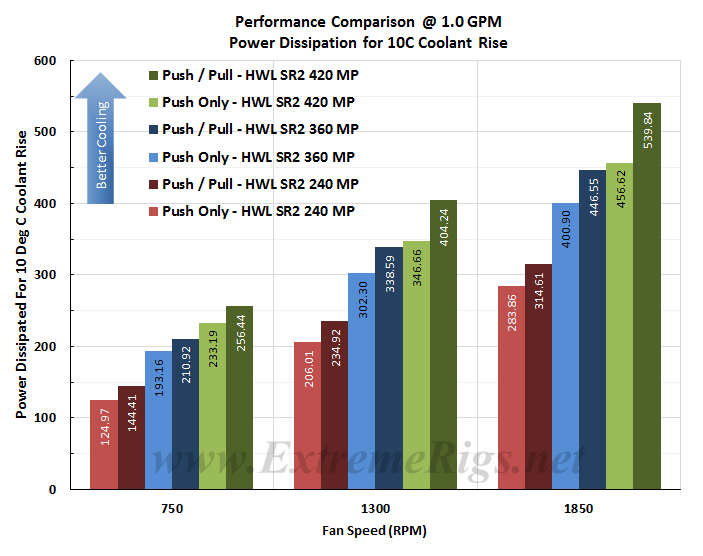
 Another way of looking at the results above might be to combine the results and plot them on a vertical bar chart.
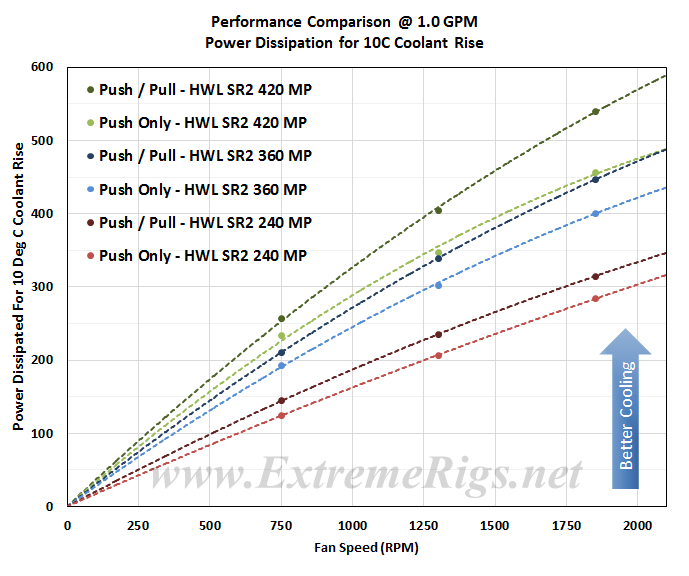
 And one last view, plotted as curves and adding some extrapolation.
 This perhaps best shows just how close the results are!
From all of test results we created “Average Performance Factor” charts for both Push and Push/Pull and then a combined plot called the “Master Performance Factor”. The radiator with the best cooling ability (W/10ΔT) at each rpm was awarded a score of 100, and each other radiators W/10ΔT result was scored as percentage of the top performer.
This way of looking at the comparison takes away any advantages that a radiator may have at higher or lower fan speeds and looks at an overall average. While this appears fair it does tend to favor those radiators that are all-rounders and those radiators which do very well at high RPM. Most users should be more focused on their specific use case.
Here is the SR2’s percentage scores at each data point that thermal tests were conducted at with the addition of the SR2’s Push Only results relative to the Best performing Push/Pull results
The percentage numbers in the table offer another way of looking at the SR2’s results comparatively and how it performed, but for our scoring system we need a way to reduce the categories while retaining the data. To do this we average the results for each fan assembly type giving us Averaged Performance Factors for Push Only, Push/Pull and finally an average of everything in the Master Averaged Performance Factor.
Firstly – the Push Only APF:
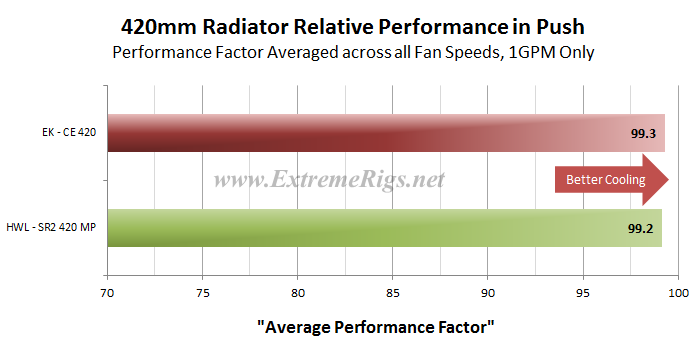 Incredibly close, almost unbelievably so!
Now the Push/Pull APF:
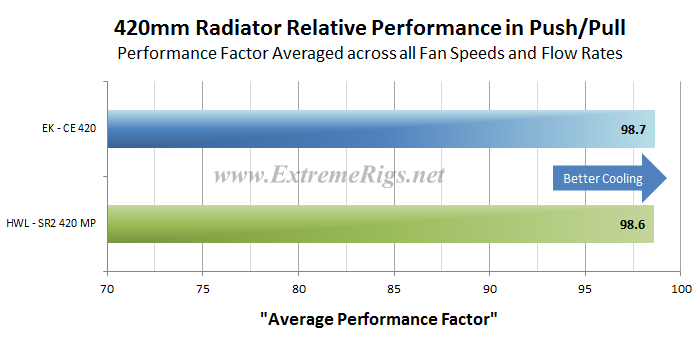 Again – 0.1% is all that separates the two radiators’ averaged results – well within the margin of error.
Finally we created the Master Performance Factor which is calculated from the averaged results of all the Push Only and Push/Pull thermal tests, at all fan speeds.
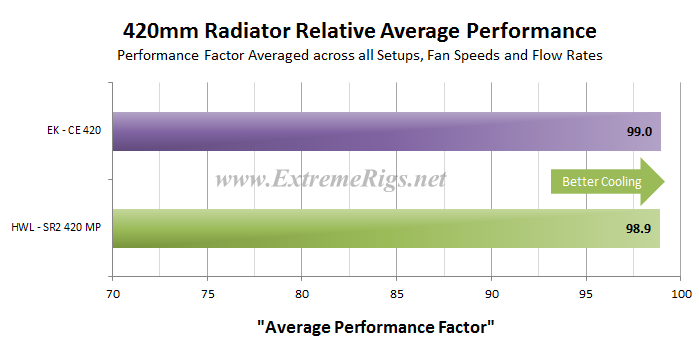
After over 100 hours of logging time and another 10 hours or so of data processing, the result is too close to declare a decisive a winner. The The EK CE’s winning margin of just 0.1% is not conclusive enough and we therefore declare the 2 radiators have equal thermal performance after averaging out across the tested fan speeds.
Quite incredible considering the differences in size and core dimensions!
Before we move onto the summary let’s take a look at some comparisons between a couple of different sized SR2 radiators thermal performance. We did test the 360mm version at 3 flow rates, but only the 1.0 GPM data has been used in the charts below.
 The most noteworthy point of interest is how close the Push/Pull 360 is to the Push Only 420 results at medium and high speeds. Of course they have different fans putting out different CFM, but both fan types we consider “best in class” and so could be considered a “somewhat fair” comparison of heat dissipation. A much better comparison would be Thermal Performance Vs. Noise instead of the Vs. RPM as above, but at this time we still have more fan testing to complete before we can use our fan data.
We can also plot the same data and extrapolate.
A note copied from our SR2 240 MP review on the heat load applied for rads other than 360mm.
“Having done then 360mm testing previously we had to decide how we were going to set up for testing other sizes. There were two practical options, both of which had advantages and disadvantages and none of the ER staff could ever really agree on which was the better option.
The first option was to run a power load proportional to that which was run for the 360mm rads, which was 300 Watts. For 240mm rads that would be 200 watts, being 66% of the surface area of a 360mm rad. This would show us the scalability of the different size of each model rad quite well, but the comparison results would be likely to end up in the exact same order as the 360mm Round Up and therefore maybe not the best comparison for readers who may be looking to purchase one or the other size of a particular radiator.
Another problem with this option is that the heater used for testing is 300 Watt, so for larger rads such as 420mm, 480mm and 560mm another heater would need to be incorporated in the test chamber loop, which would be a big change to they system in itself that would likely then render the test system useless for comparisons to older test data (any system change makes things no longer apples to apples – and yes the system is that sensitive).
The second option, which is what we have decided to use, was to run with 300 Watts on the 240 radiators. This mirrors the fact that we keep the heatload constant even when changing fan RPM. This gives a good comparison between different sizes of the same rad, as we are simulating a set load in a similar way to which a running system might. The downside to this test method is that we may run into temperature issues. On the smaller 120mm and 140mm rads 300 Watts is just going to be too much for them to dissipate with safe and acceptable coolant temps, so we may end up not getting full sets of data, in particular the Push Only 750 RPM data point would be almost certain to have coolant temps which are too high to test at. On the other end of the scale for any 480mm or 560mm rads, the cooling potential is likely to be very high resulting in very lower Delta Temps which could lead to data having to be discarded, particularly for the Push/Pull 1850 RPM data point.
There is no right or wrong choice, the results would just be slightly different due to Delta Temps being different between the two test options. In the end we are happy with the option which we chose as we believe is offers the reader a better comparison between different size radiators as they have all been tested under the same conditions. However as a reader you should be aware that W/10DT numbers are not calculated here with a delta of 10C so radiators with higher temperature deltas are operating more efficiently and will score higher than perhaps they should for a true scientific accurate test of heat dissipation for a 10C delta.”
Next up – Summary!


Thank you for the hard work! The section about testing methods was especially interesting. I have to wonder though… a silver award with a score of 4.5 out of 5? Is this a “goldish” silver or satin nickel silver? 😉
We discussed the appropriate award to be issued and in the end it came down to 3 reasons why we did not issue gold.
The price point is very high compared to the radiator in the review.
We would like to see the ancillary port introduced.
And to a lesser degree the review sample had a few issues with the paint finish.
So while the SR2 MultiPorts are an excellent radiator choice, we feel there is still room for a little improvement.
Let’s call it a Goldish Silver 🙂
HWL doesn’t list the non-multiport version any longer on their website and that is unfortunate. For a lot of reasons, multiport isn’t ideal in all circumstances. If there are stop fittings installed, there will likely be clearance issues.
Comments are closed.