


")
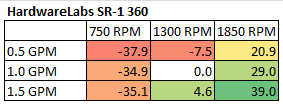
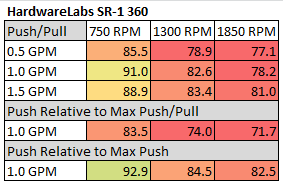
Using the data compiled from the SR-1 thermal testing I have compiled the following tables in an attempt to show another way how the SR-1 performance varies against itself at the flow rates and fan speeds tested.
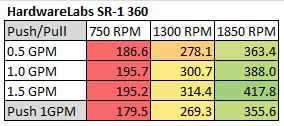
We can then use these to show percentage gains relative to a reference point. It’s an interesting way to show gains/losses while changing a variable. This first table shows performance gain or loss relative to 1.0GPM flow rate:
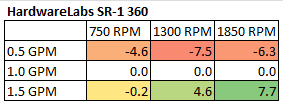
This shows that increasing flow rate matters in some cases, but not a huge amount.
We can also focus on 1300RPM as our reference and see how much gain or loss in performance we get by changing fan speed:
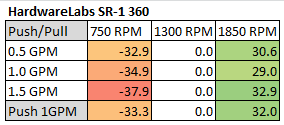
As expected the change is dramatic. Unexpectedly this rpm based plot shows up quite well how little the SR-1 is affected by change in the flow rate. It got me to thinking how a reference point of 0.5 gpm and 750 rpm would look when plotted.
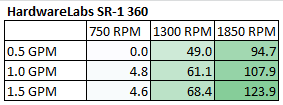
It wasn’t quite what I was expecting; it does however show again that increasing flow rate has a small effect on increasing performance. At the same time it shows percentage increases of the different gpm/rpm combos tested.
Lastly we can combine both and choose 1300 RPM and 1.0 GPM as our reference point to show both effects concurrently:
So from the data above we can get a very good idea of how the SR-1 radiator performs relative to itself. But there is a large selection of 360mm radiator models to choose from, released from numerous manufacturers. So, we need to start comparing performance between them. To see how the radiator performed against the other radiators in this group I have included the averaged flow rate comparison charts from the Round Up. We know that the flow rate has little impact on thermal performance so averaging of the 3 flow rate results gives us a good look at head to head push/pull performance at the rpm speeds tested at with even less error.
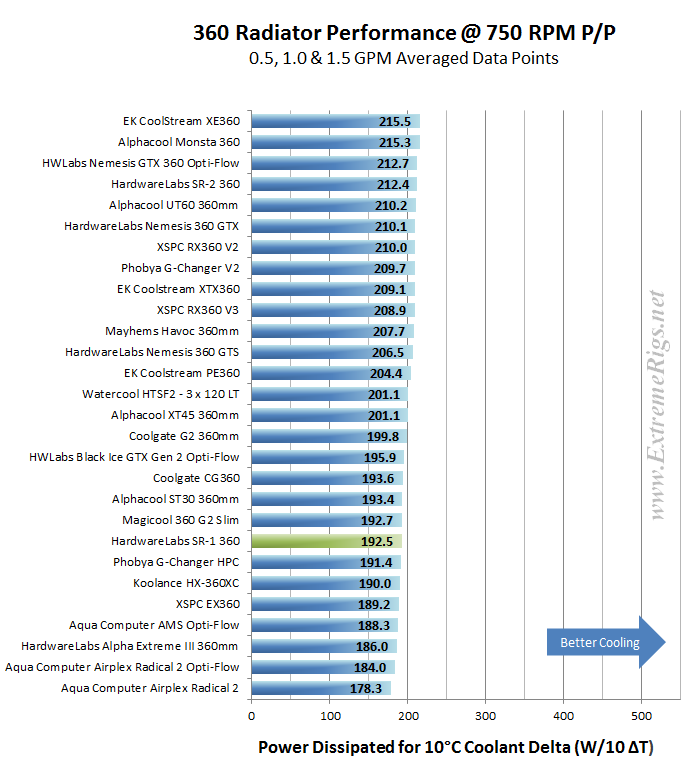
First, let’s look at Push only data:
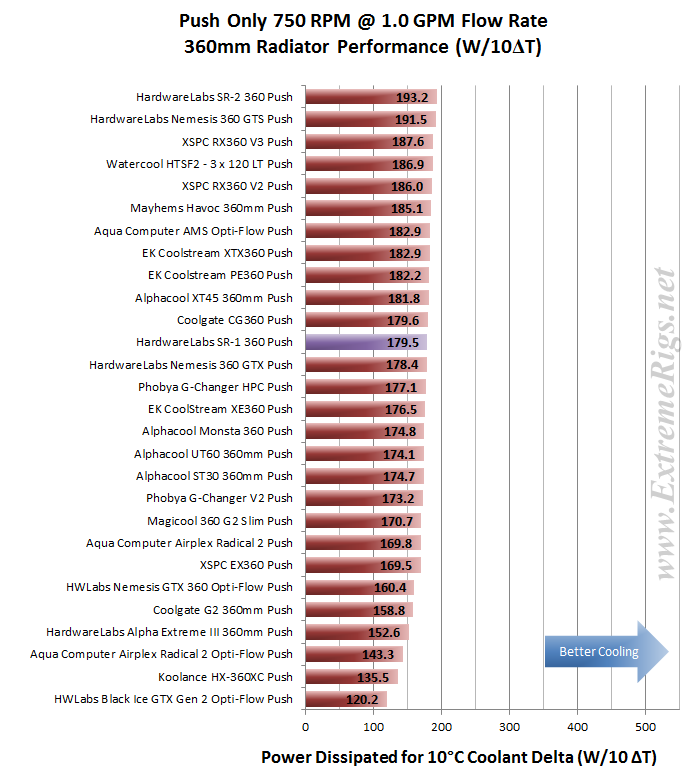
At 750RPM the SR1 is in the upper half. As we know this is a radiator tuned for low speed fans, we will be expecting this to be it’s best result.
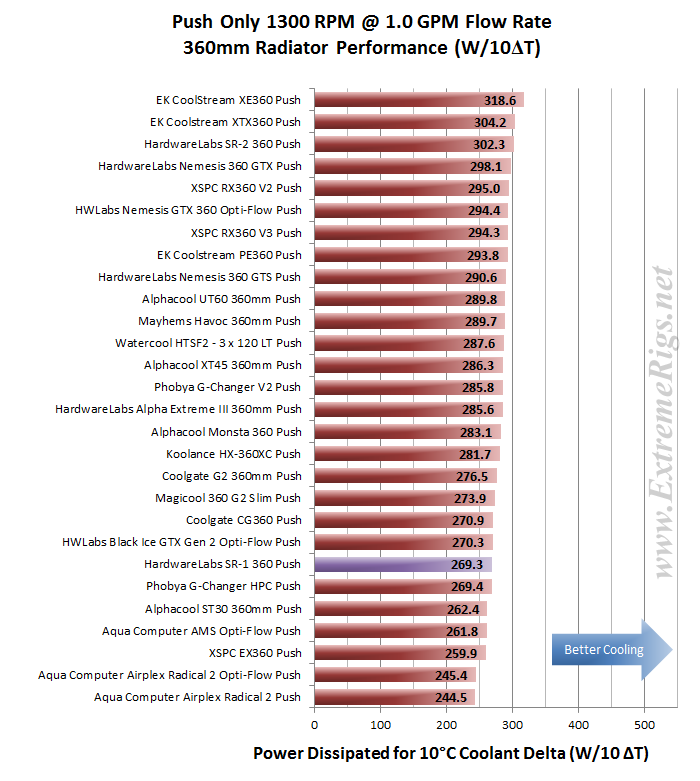
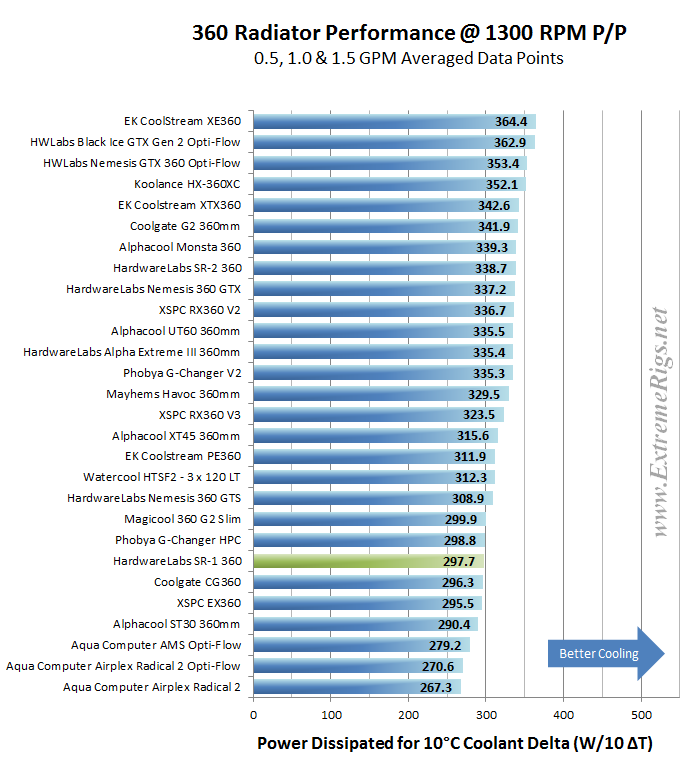
At 1300RPM the results match expectations with the SR1 already dropping closer to the bottom.
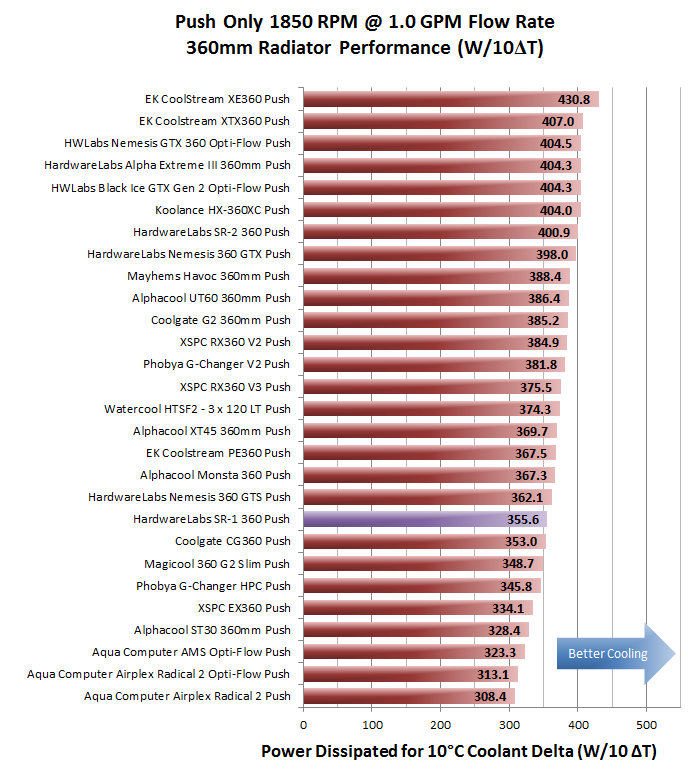
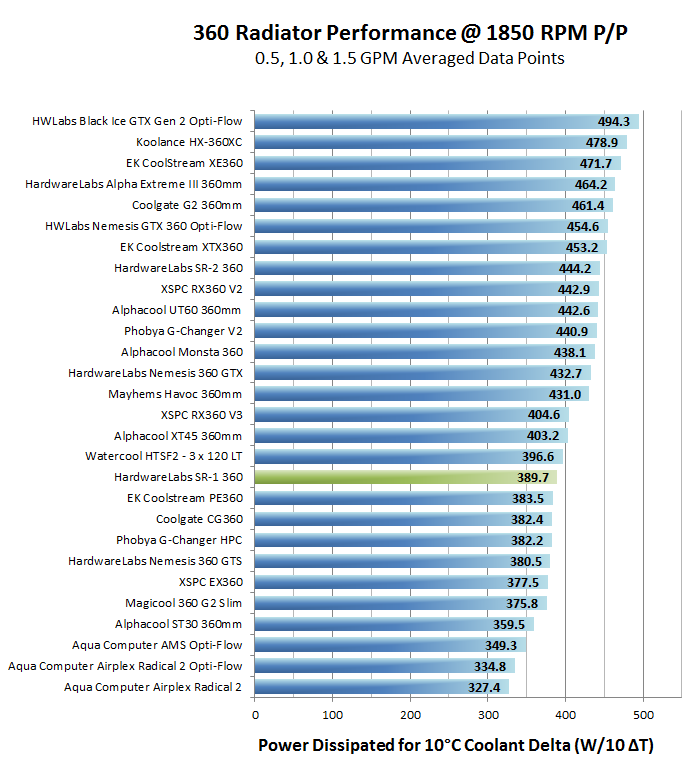
At 1850RPM though the SR1 did not go into freefall but kept scaling and indeed picked back up a few spots.
Now let’s look at push/pull:
At 750RPM the SR1 now does worse than in push. This is not a surprise given that it didn’t scale well with push/pull.
At 1300RPM nothing improves.
At 1850RPM the SR1 again picks up a little bit.
Using only the 1GPM data we can compare Push to Push/Pull in an “apples to apples” fashion:
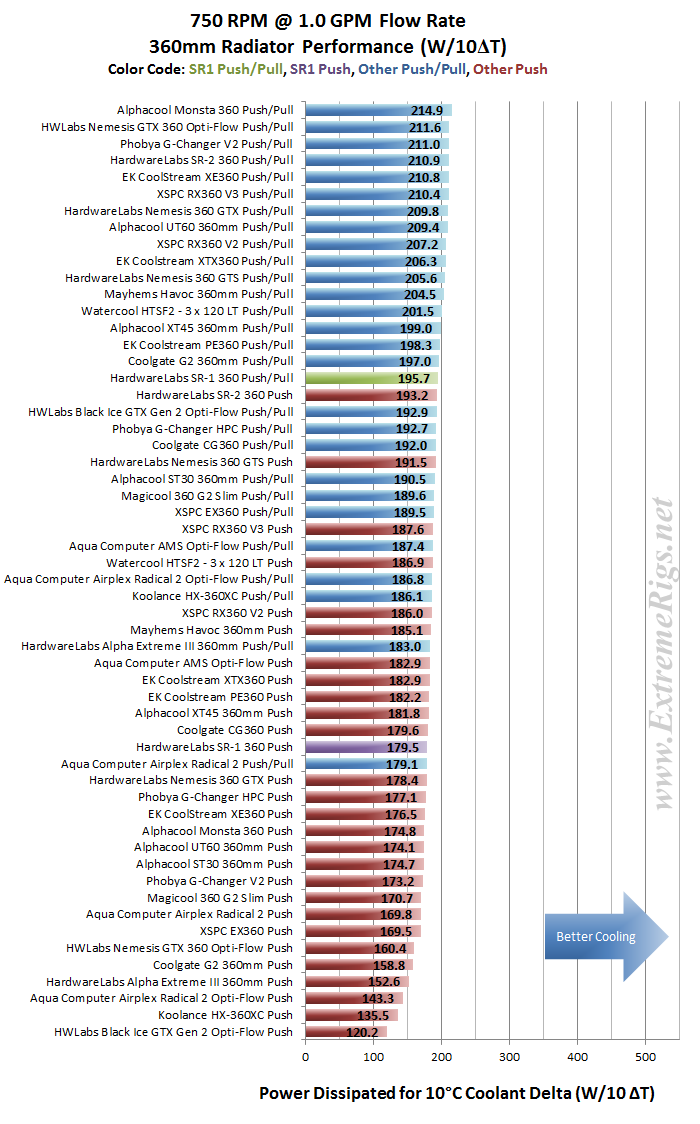
The plots are very busy, but the color coordination can help seperate things out. at 750RPM then the SR1 in Push/Pull is nearly overtaken by it’s cousin the SR2 in push. Meanwhile at the lower end, the SR1 in Push is itself overtaking the worst Push/Pull setup.
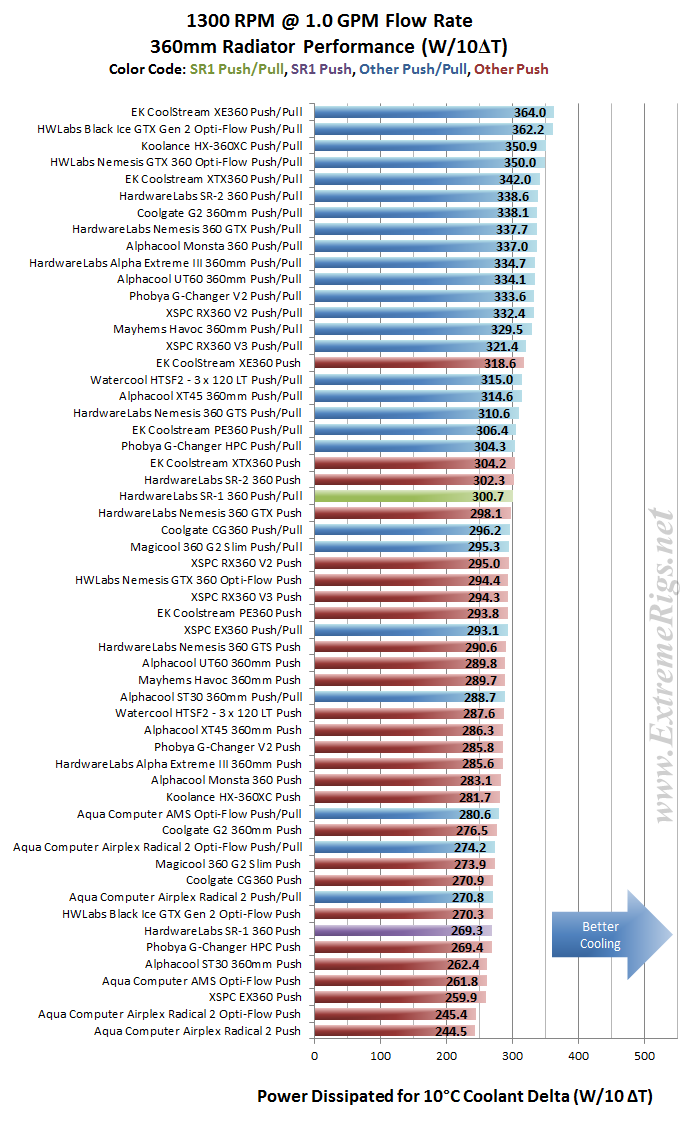
At 1300 RPM the SR1 P/P setup is getting overtaken by more Push only setups.
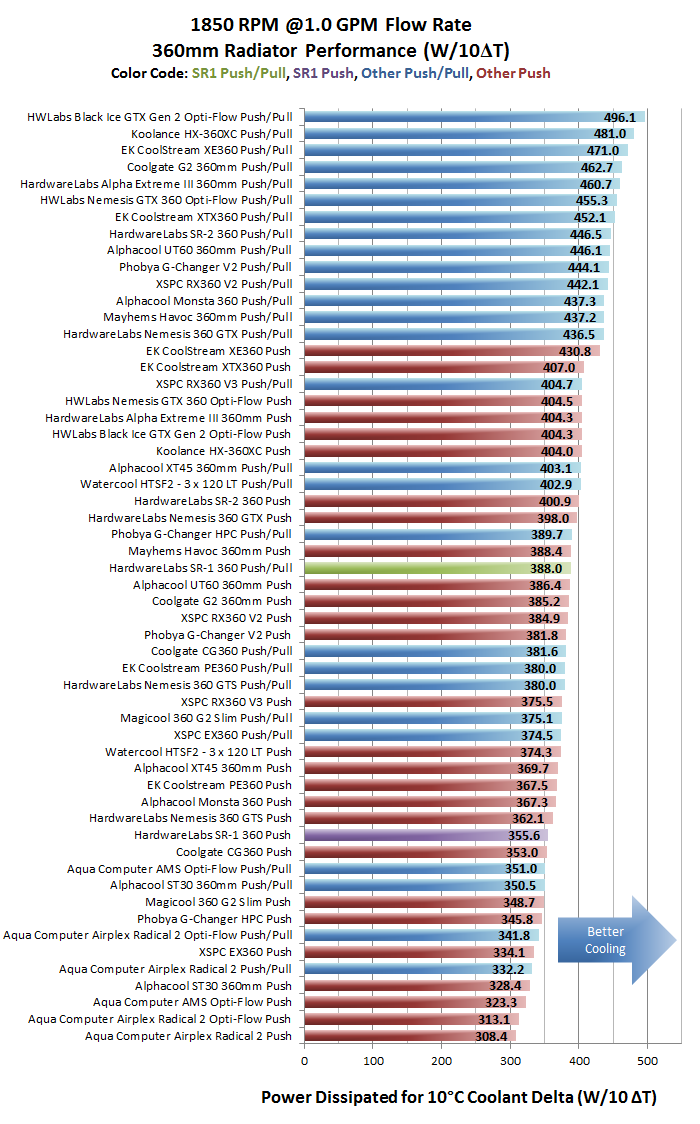
At 1850RPM the SR1 just doesn’t come across as a performance radiator.
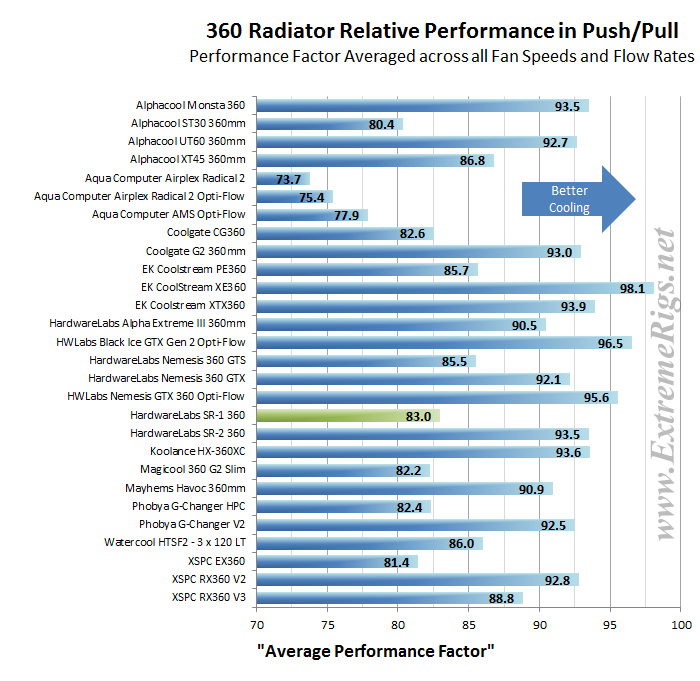
From all of these results we can create a “master performance factor”. The radiator with the best cooling ability (W/10ΔT) at each gpm/rpm combo was awarded a score of 100, and each other radiators W/10ΔT result was scored as percentage of the top performer:
This plot shows better how the SR-1 actually performs better comparatively at lower fan speeds. As the fan speeds increase it falls further behind the leaders in the test group. Indeed, testing at <500RPM may have really allowed the SR1 to shine. The linear performance of the SR-1 shows up, again unexpectedly with the percentage difference in the rpm tests.
Then all these percentage scores were averaged giving us the Averaged Performance Factor of each radiator. This way of looking at the comparison takes away any advantages that a radiator may have at higher or lower fan speeds and looks at an overall average. While this appears fair it does tend to favor those radiators that are all rounders and those radiators which do very well at high RPM. Most users should be more focused on their specific use case. Check in the Round Up for performance comparisons at every gpm/rpm combo for even more details and cross comparison results.
Again let’s start with Push only data:
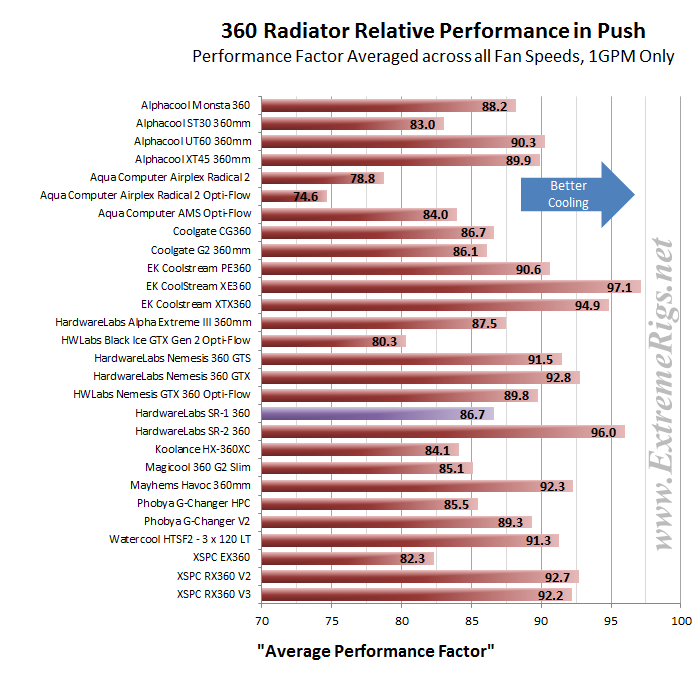
Despite some poor performance numbers the SR1’s performance at 750RPM pulls it up to an above average score.
In Push/Pull the SR1 was never expected to do well. However it could also have done a lot worse.
Next up – Summary!


[…] HardwareLabs SR-1 360 Radiator Review […]
Comments are closed.